When I discovered Aerialod software, mainly because of Alastair Rae work, I have a passion for 3D cartographic representations.
This software allows to make 3D rendering very quickly. You will find on GeoTribu’website a tutorial that I wrote on Aerialod, for a first take in hand ![]() .
.
When we talk about 3D map rendering, we immediately think of the digital field model. But in reality Aerialod can input any kind of data, as they are in an appropriate format : PNG, JPG, TIF.
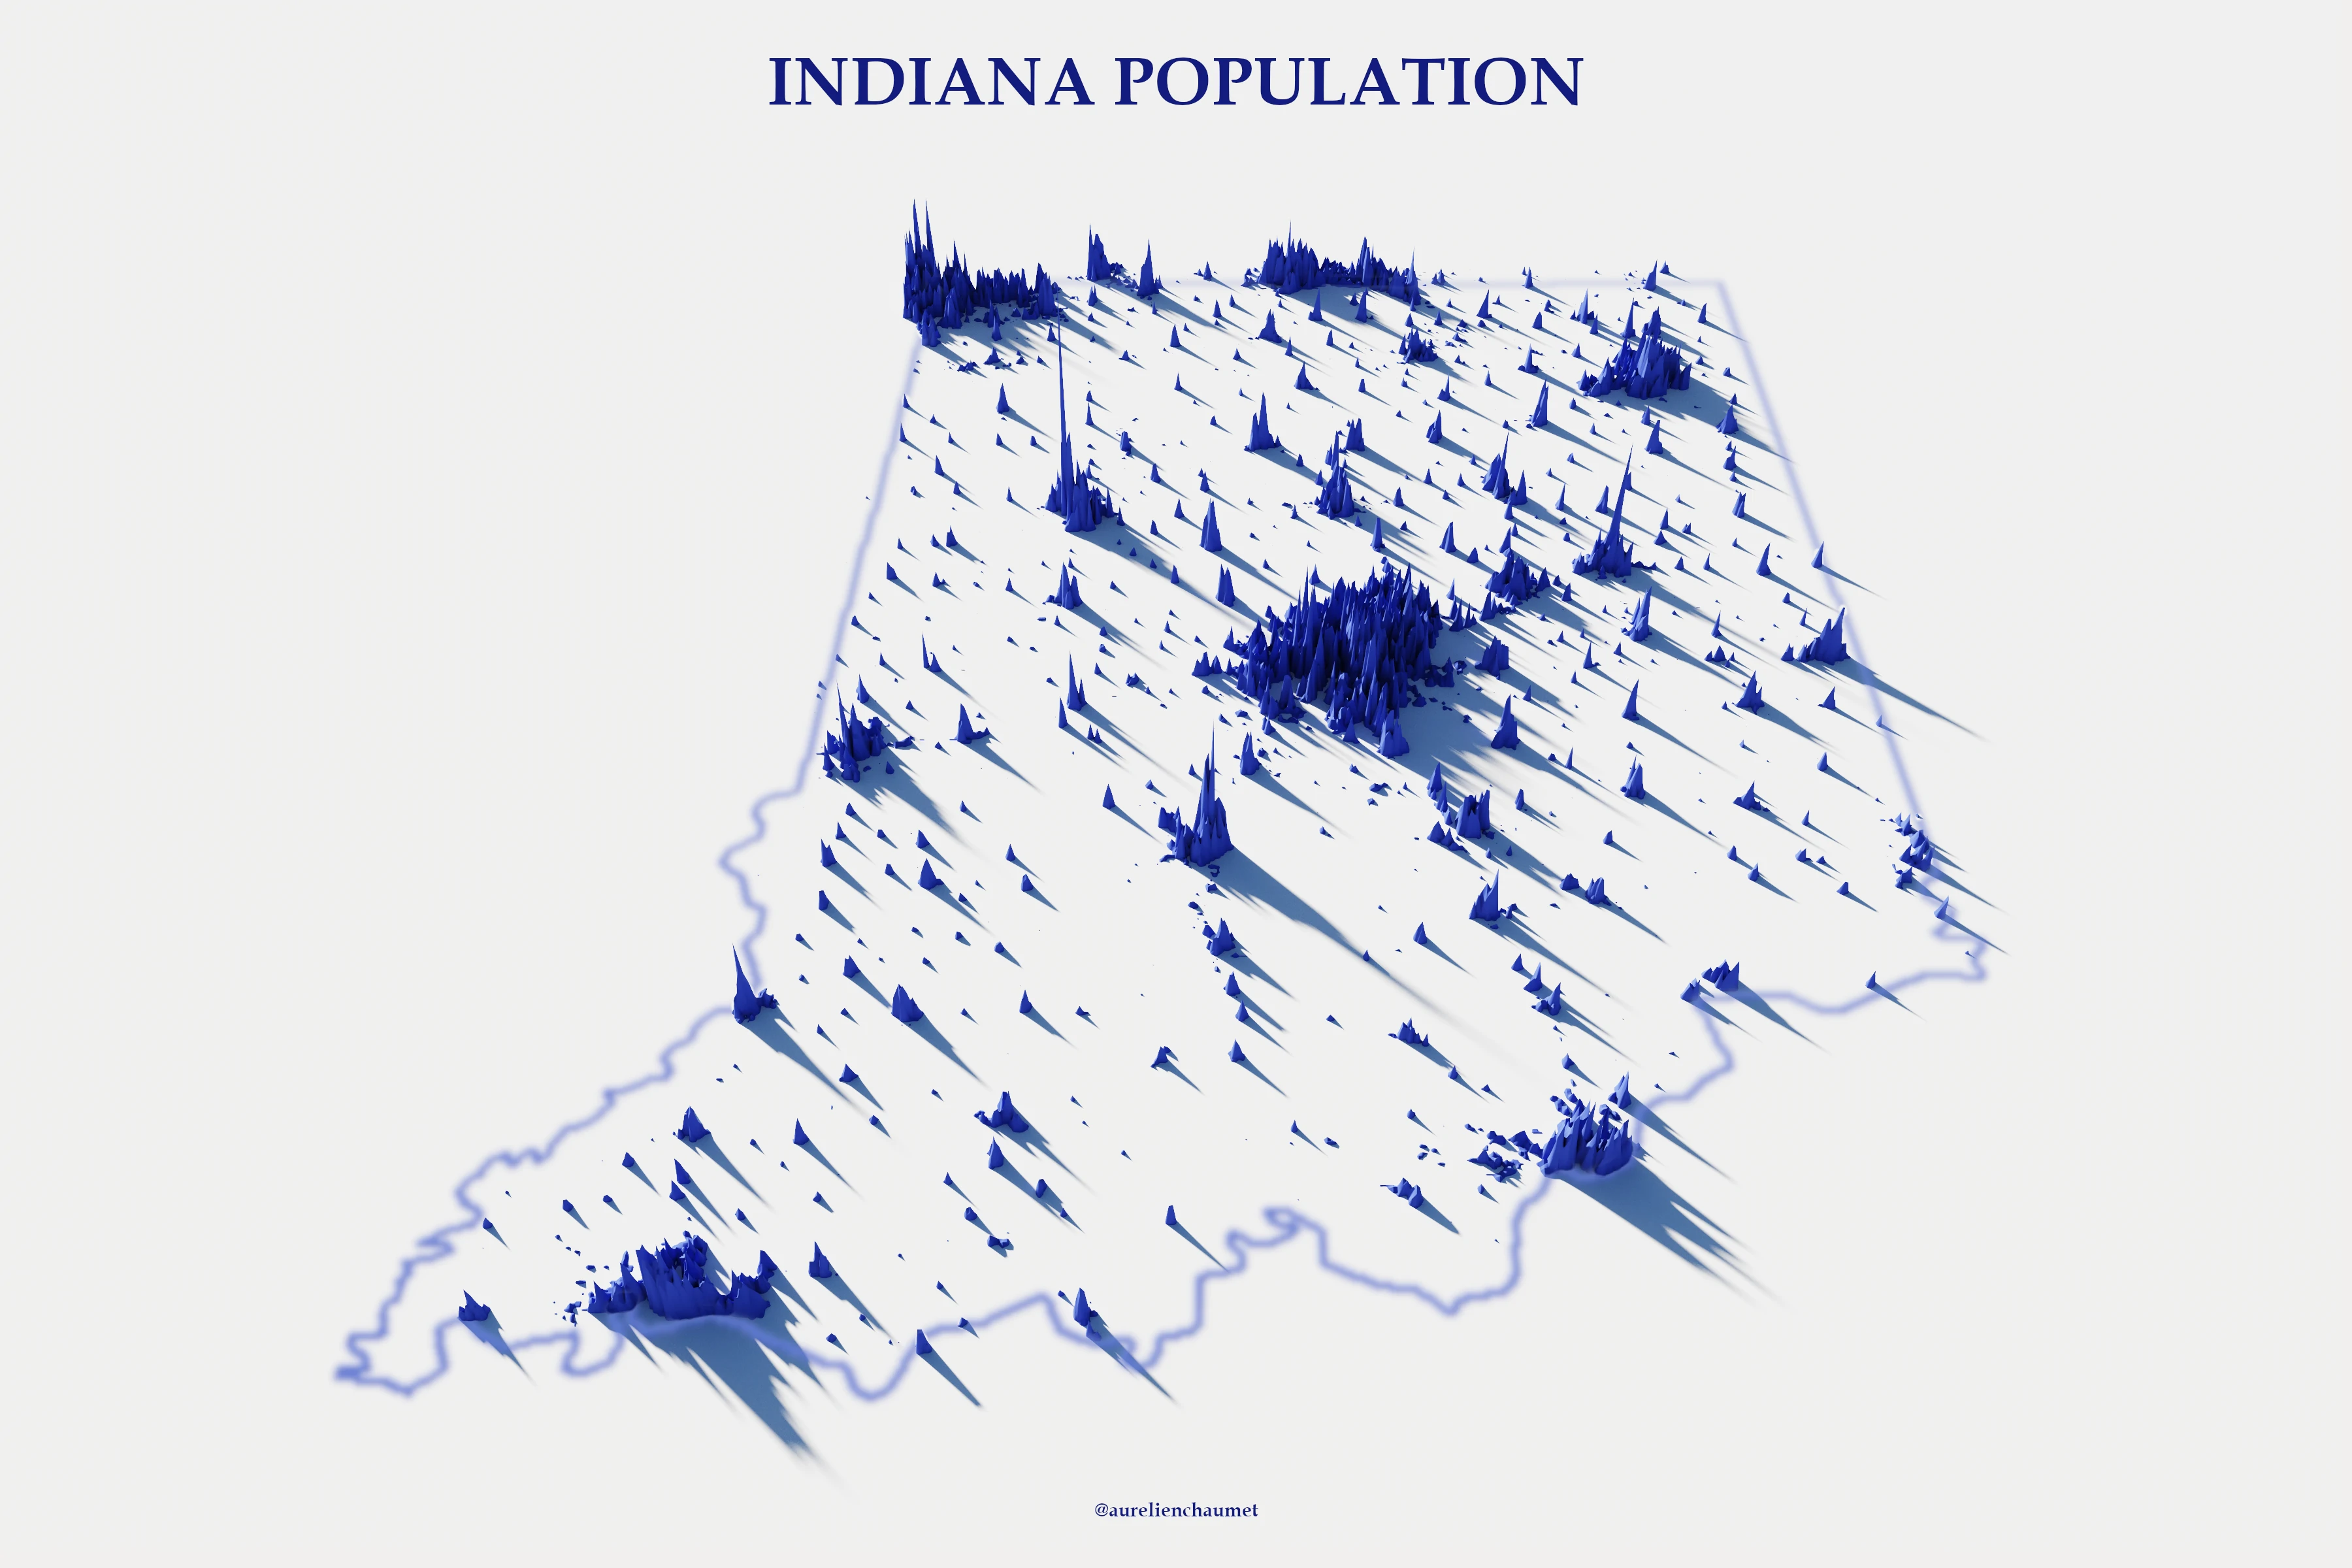
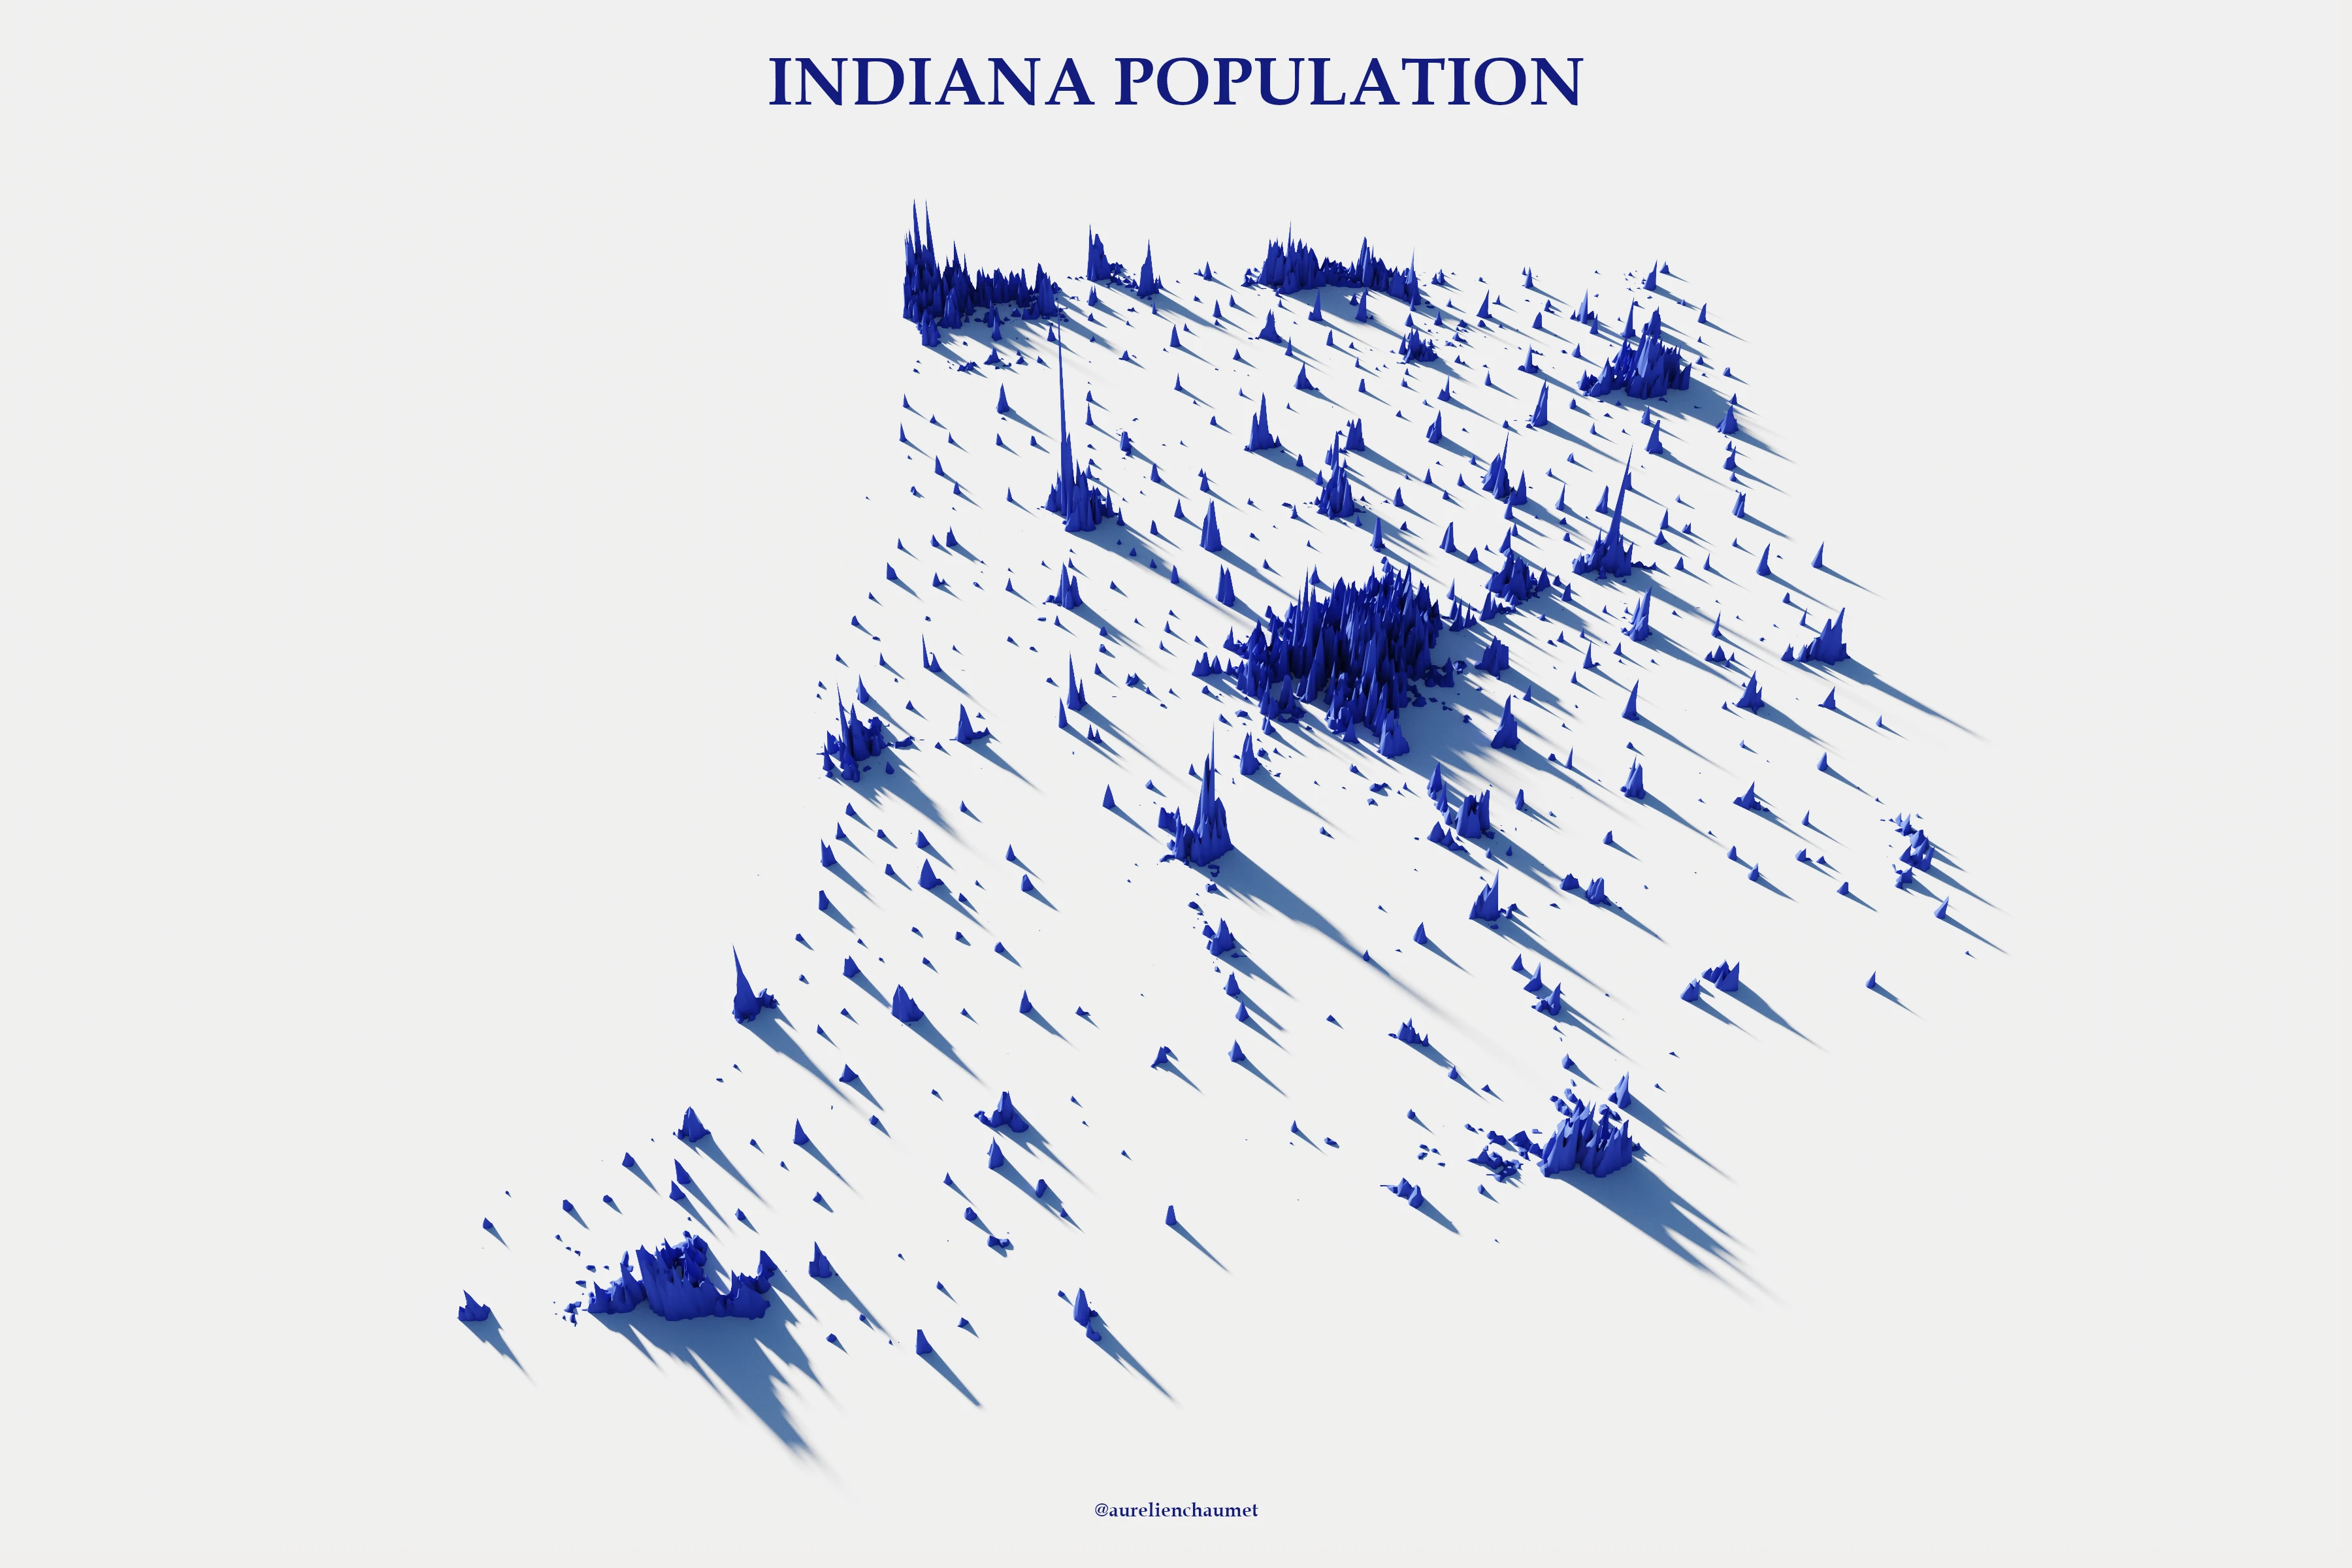
So I made a series of “test” renderings, in order to represent population densities.
Densely populated ou pas ?
Population density is usually represented by a flat color, also technically called choroplete map.
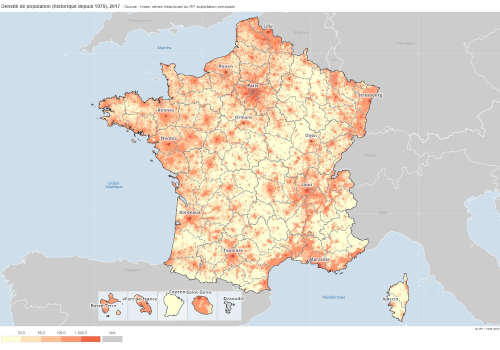
Far be it from me to question this representation, quite the contrary! The information is presented there precisely and if the symbology is well defined, the message that must be given clearly passes.
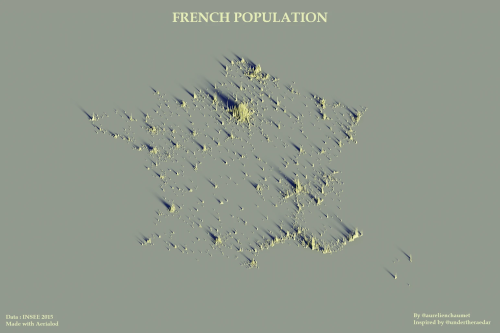
However, the fact of giving height to this type of map allows to have a new visual aspect, aesthetically different, while leaving aside the choice of thresholds in the symbology, what remains subjective choices.
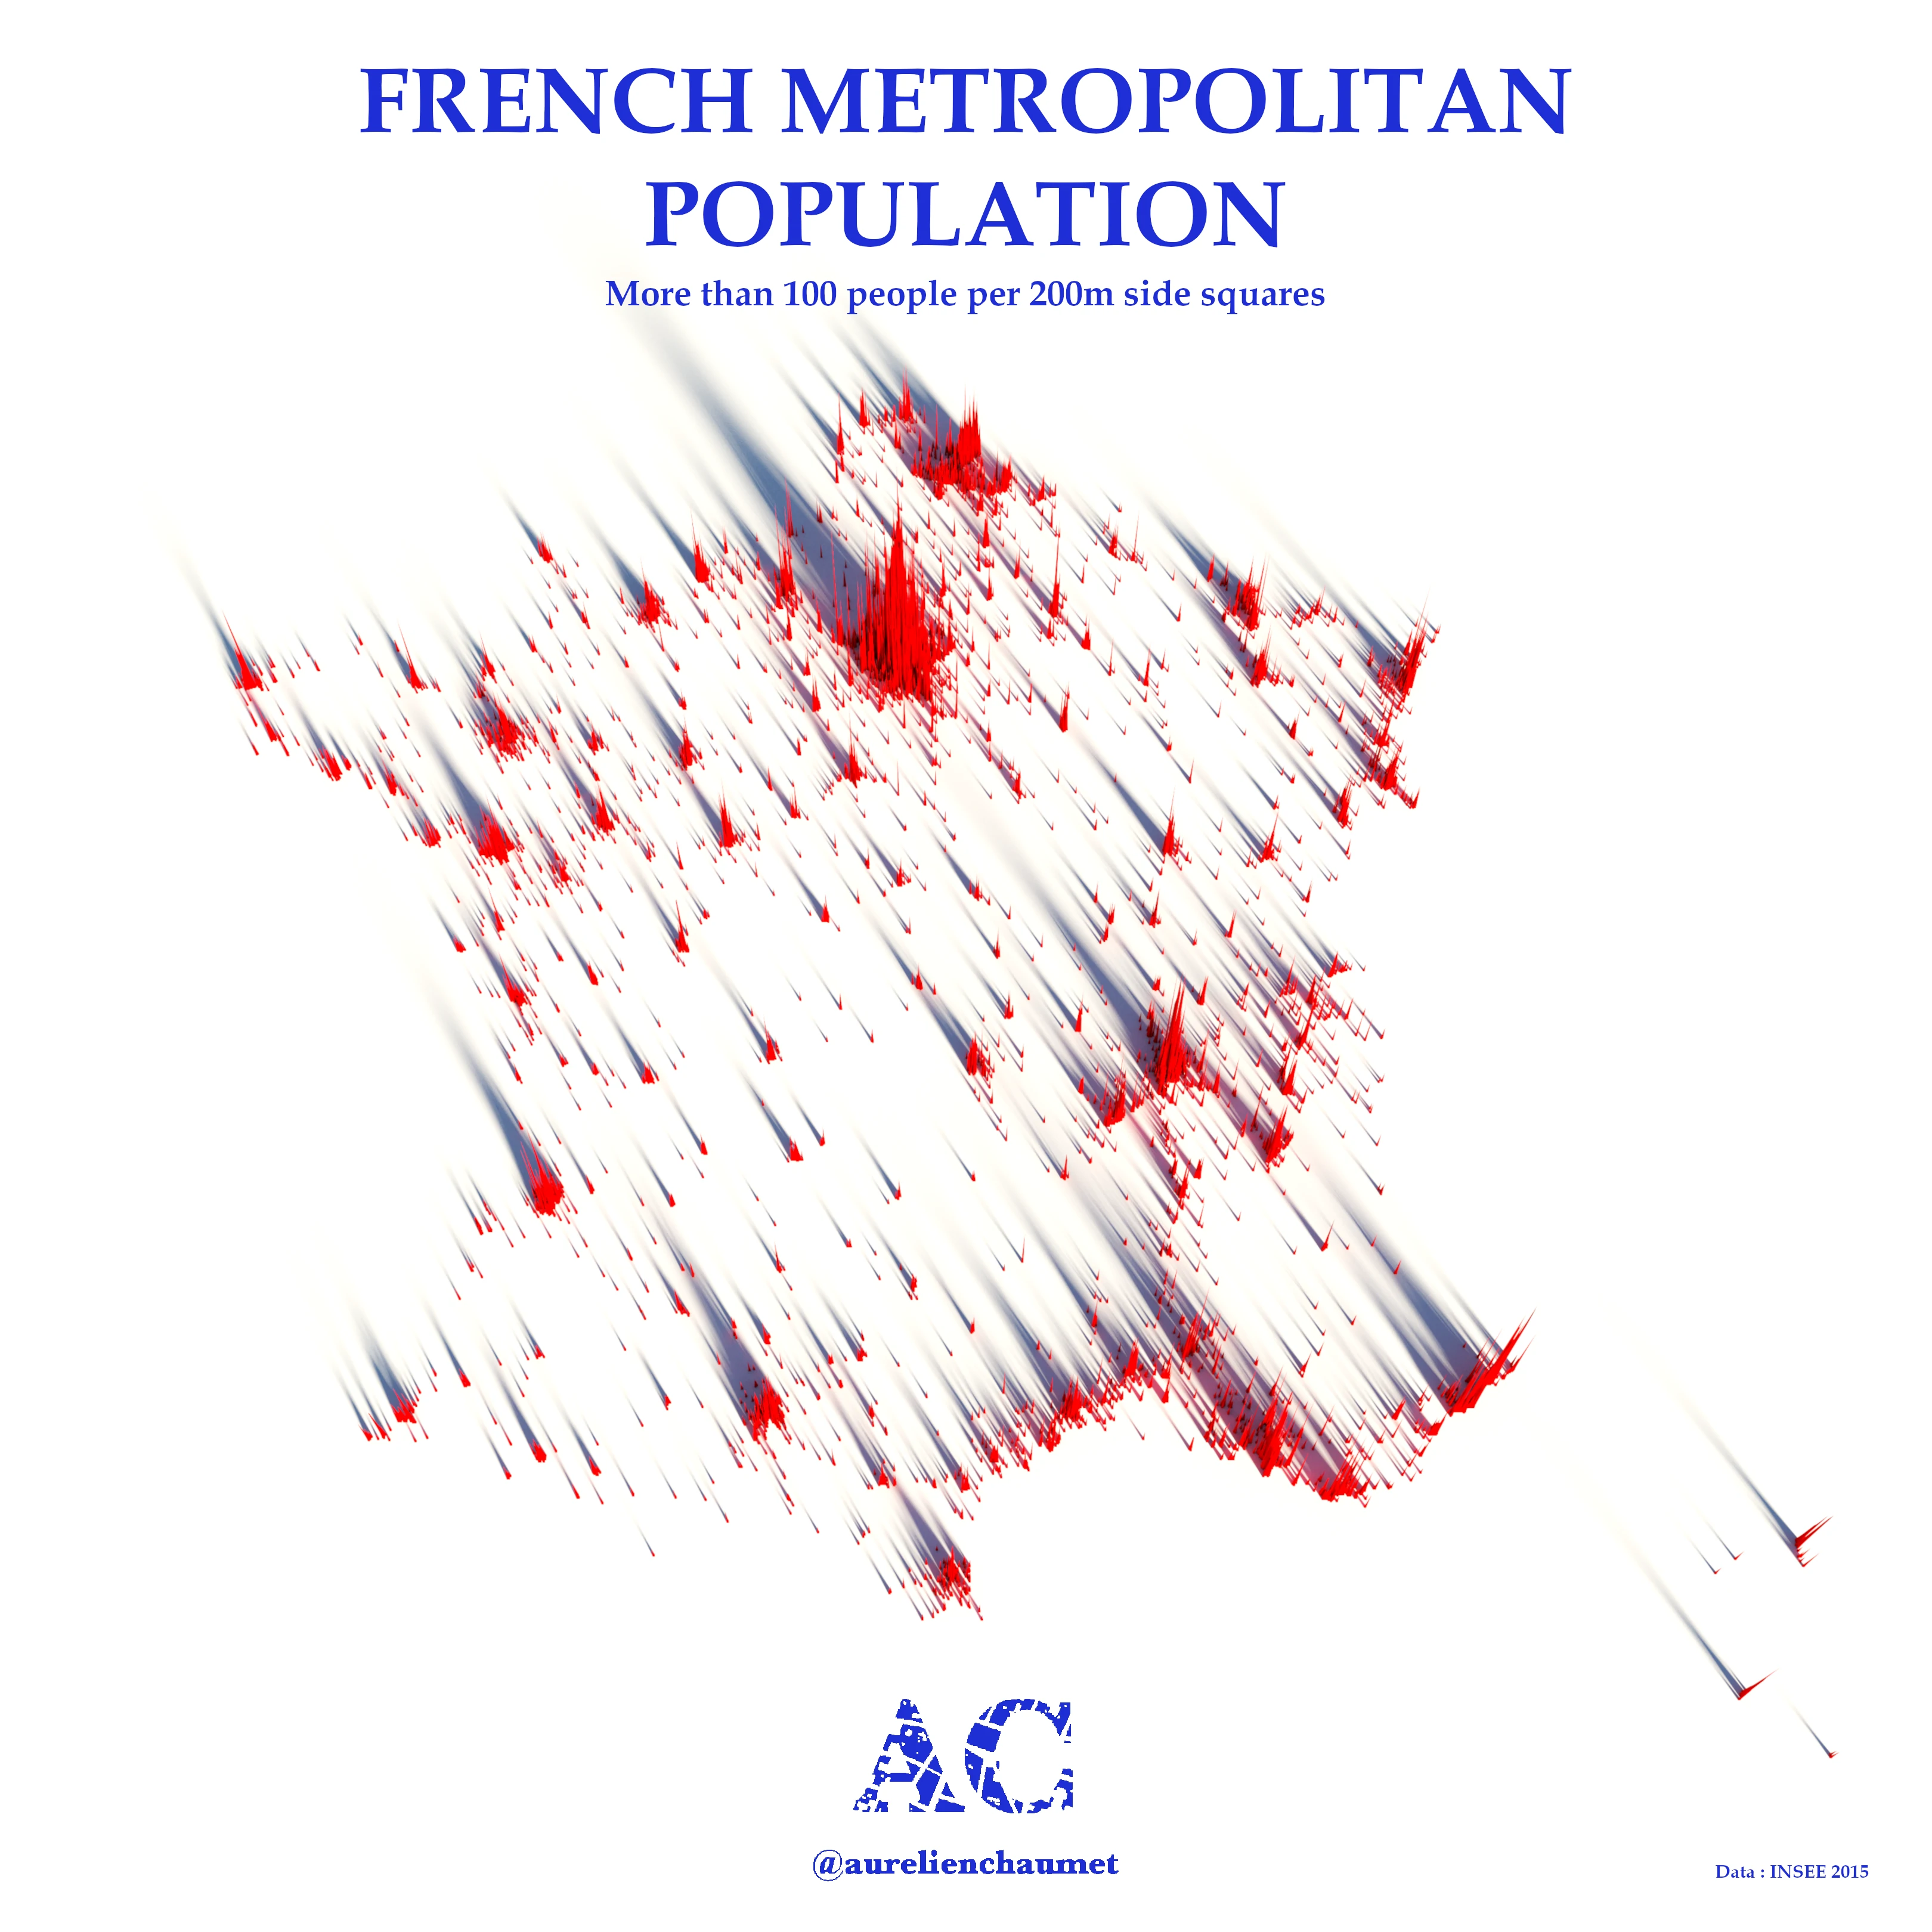
The first map I made is the French population density.
You will find in the list at the end of the article which contains all my achievements on this theme below, another version of this map.
Quite quickly I imposed myself some rules (that this first card does not respect) :
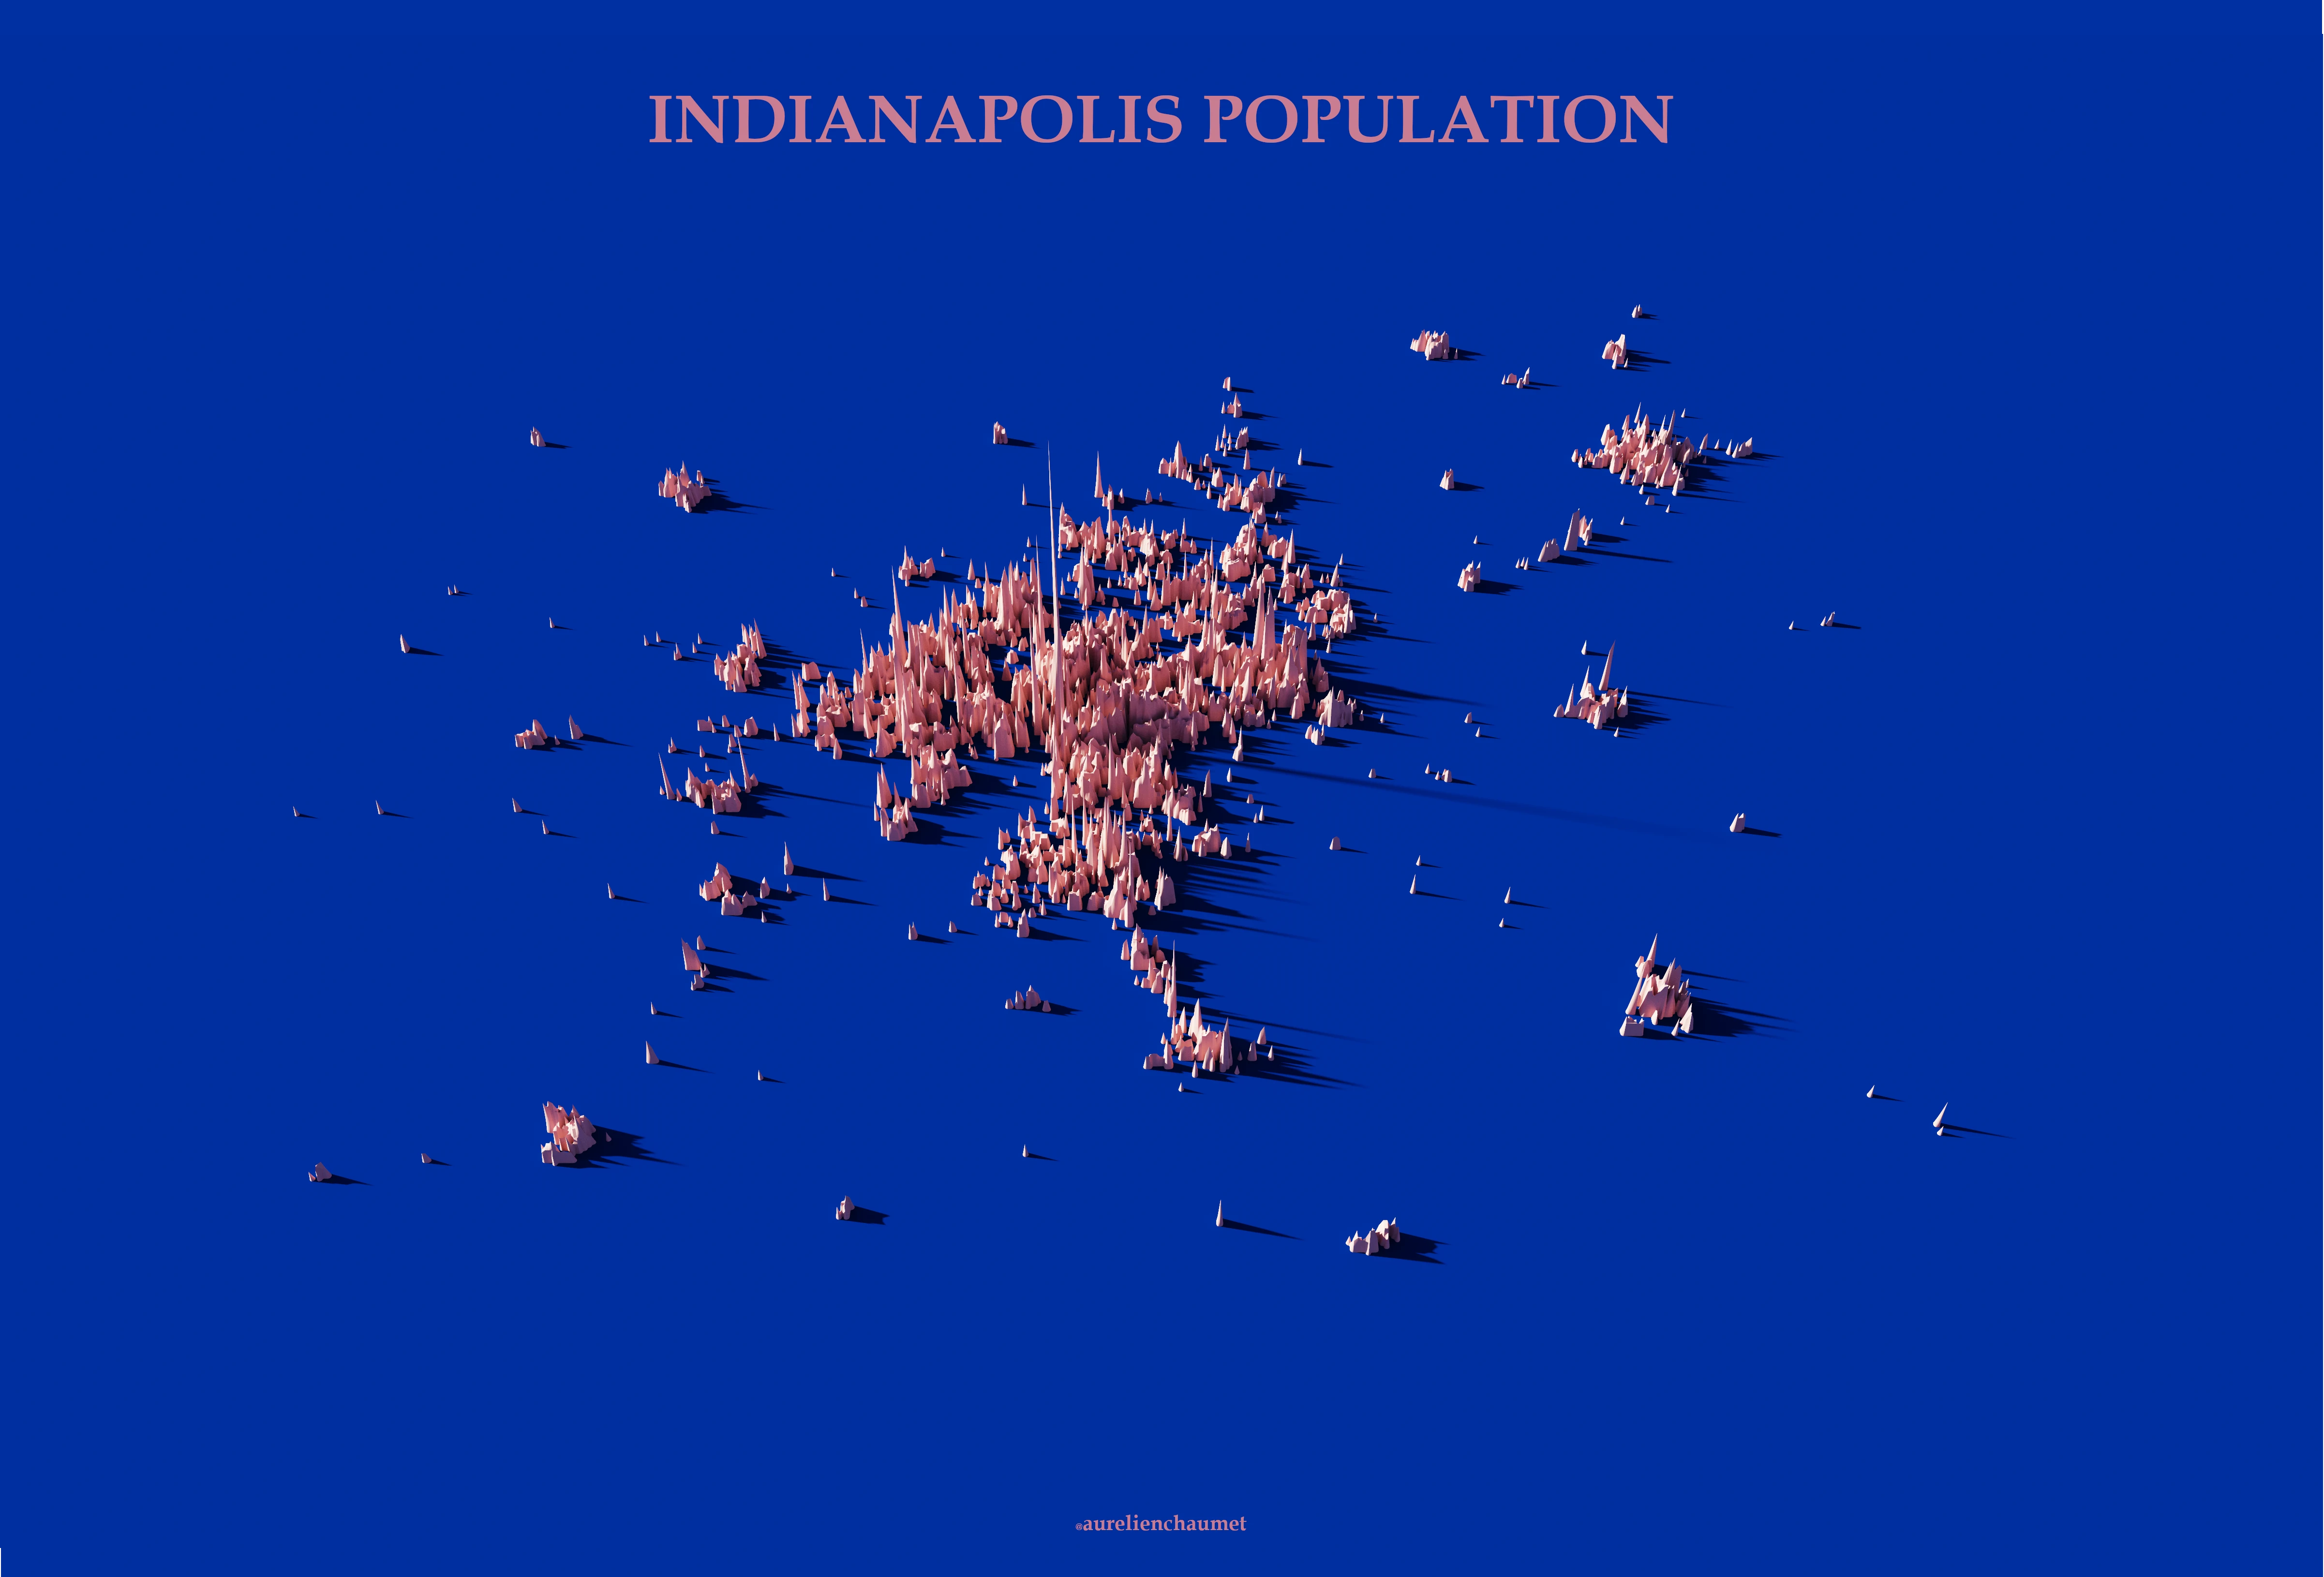
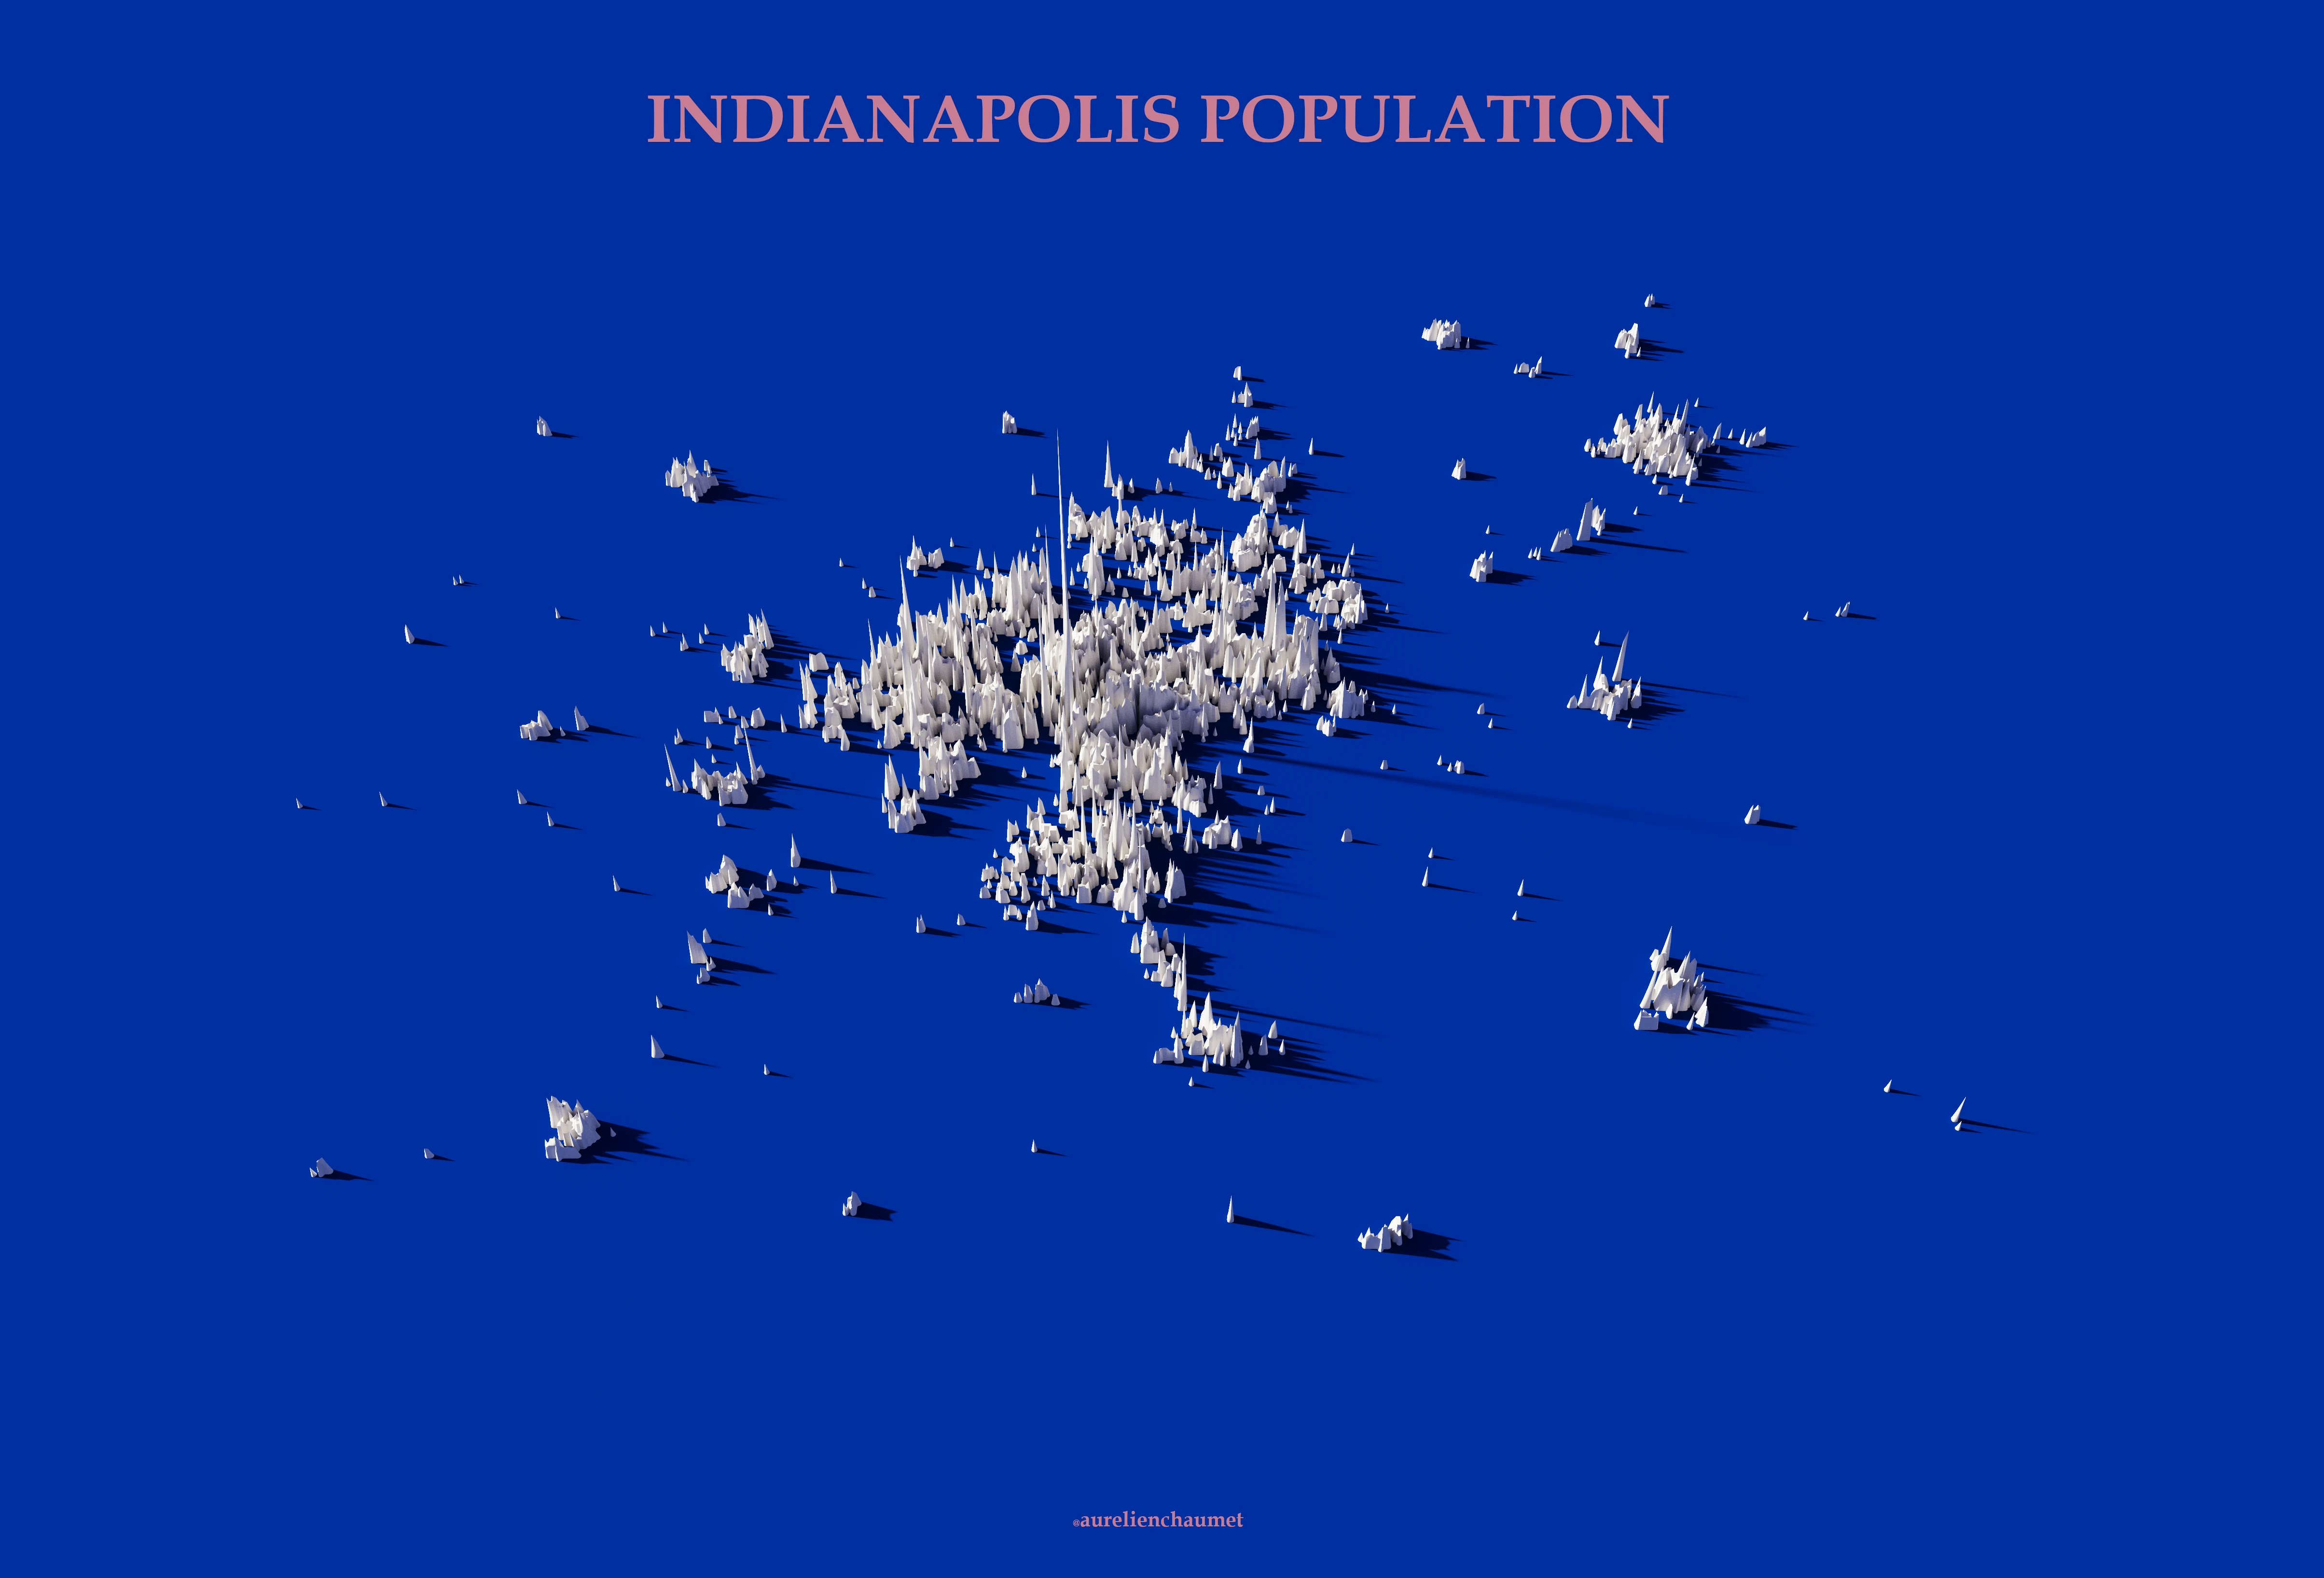
- The colours used must come from the flag of the country, state or city represented
- The entire population must be represented, not just a part. On this first map of France some criticisms were made to me, especially on Reddit and Instagram, because many voids existed. And for good reason, I had kept only the tiles of 200m side of more than 500 inhabitants. I found it more aesthetic
 . But it is certain that a card that is issued must be complete and right !
 - The rendering must have a professional aspect with a title and a source (and subsequently my logo)
This first map was made with the 2015 INSEE population data. The principle is quite simple, since Aerialod eats TIF, it is enough to rasterize vector population data.
To do it, I use QGIS et the Rasterize function.
There is then only to export the result in geotiff image (and not in raw so that Aerialod reads it).
Now let’s go to Aerialod !
Then nothing very special, level settings I systematically switch to :
- In the left panel
- Dans Sky -> “Atmospheric Scattering”
- Diffuse to 3
- In the bottom panel
- “Perspective Camera”
- In general, I use an angle between -45 and -60
- In the right panel
- Bilinear Surface Mode
If this does not speak to you, but you want to play with Aerialod, do not hesitate to download it !
It only remains to play on the colors of ground and base, and sometimes with the exposure and the angles of the sun.
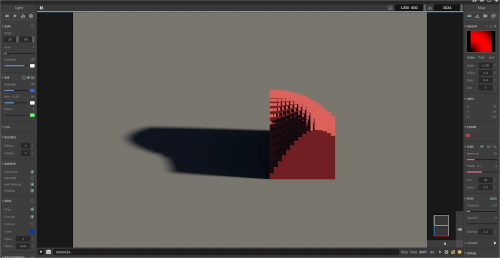
An export in png and here we go ![]() !
!
What I remember from it
Beyond the practice of Aerialod that these maps may have brought me, I will mainly remember to what point (again, it is not a surprise) the basic data is the nerve of the war.
However, each country does not necessarily have statistical institutes such as INSEE in France with the capacity to produce cross-tabulated population data.
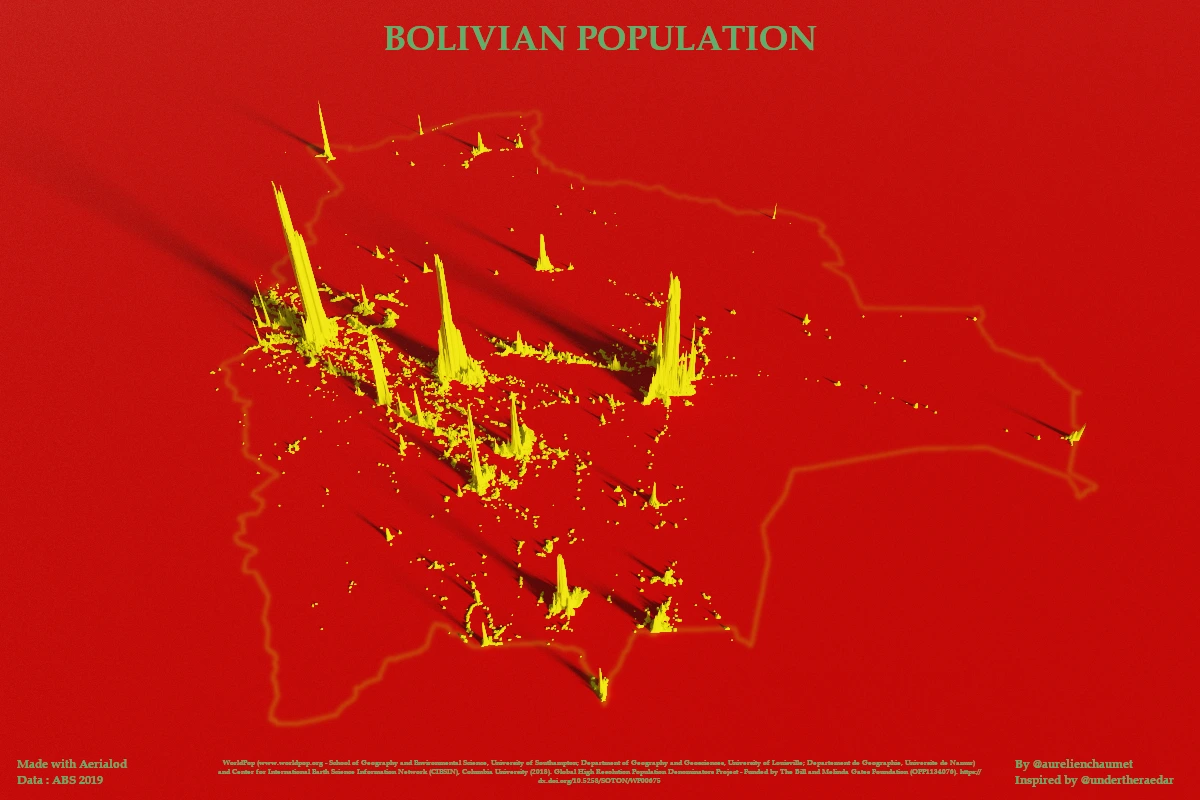
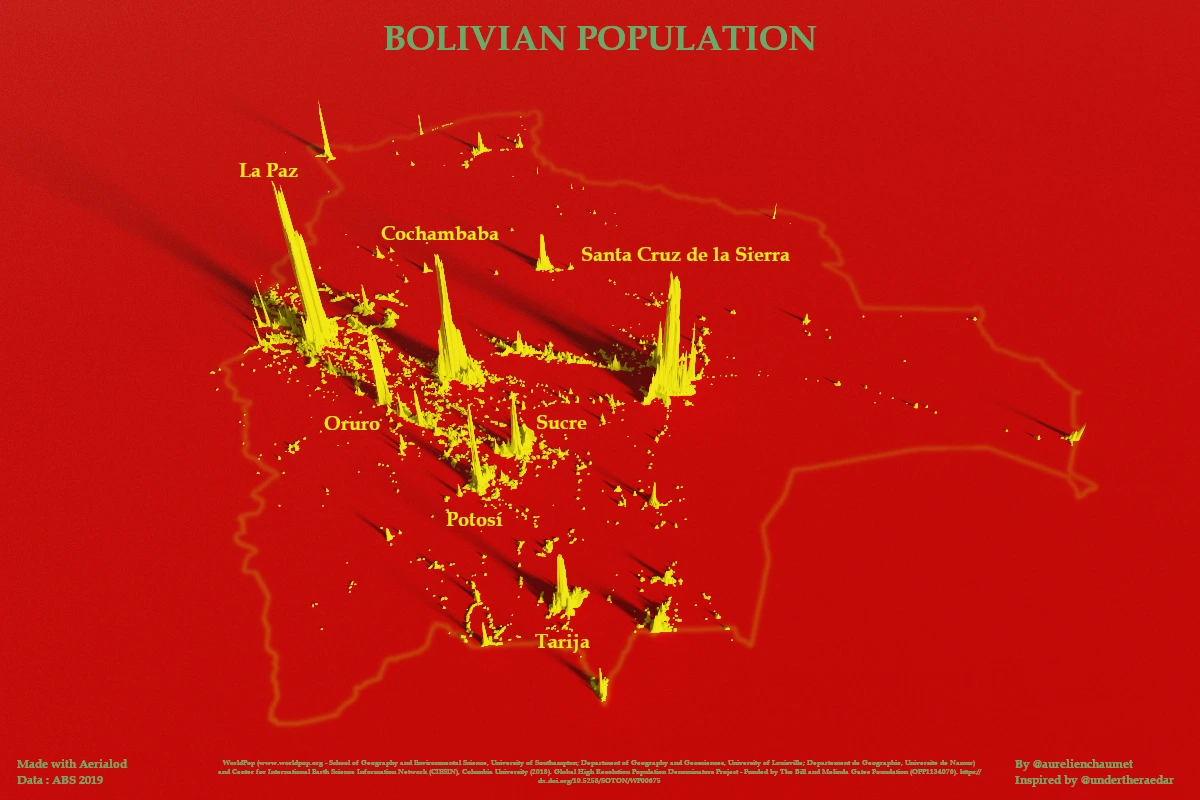
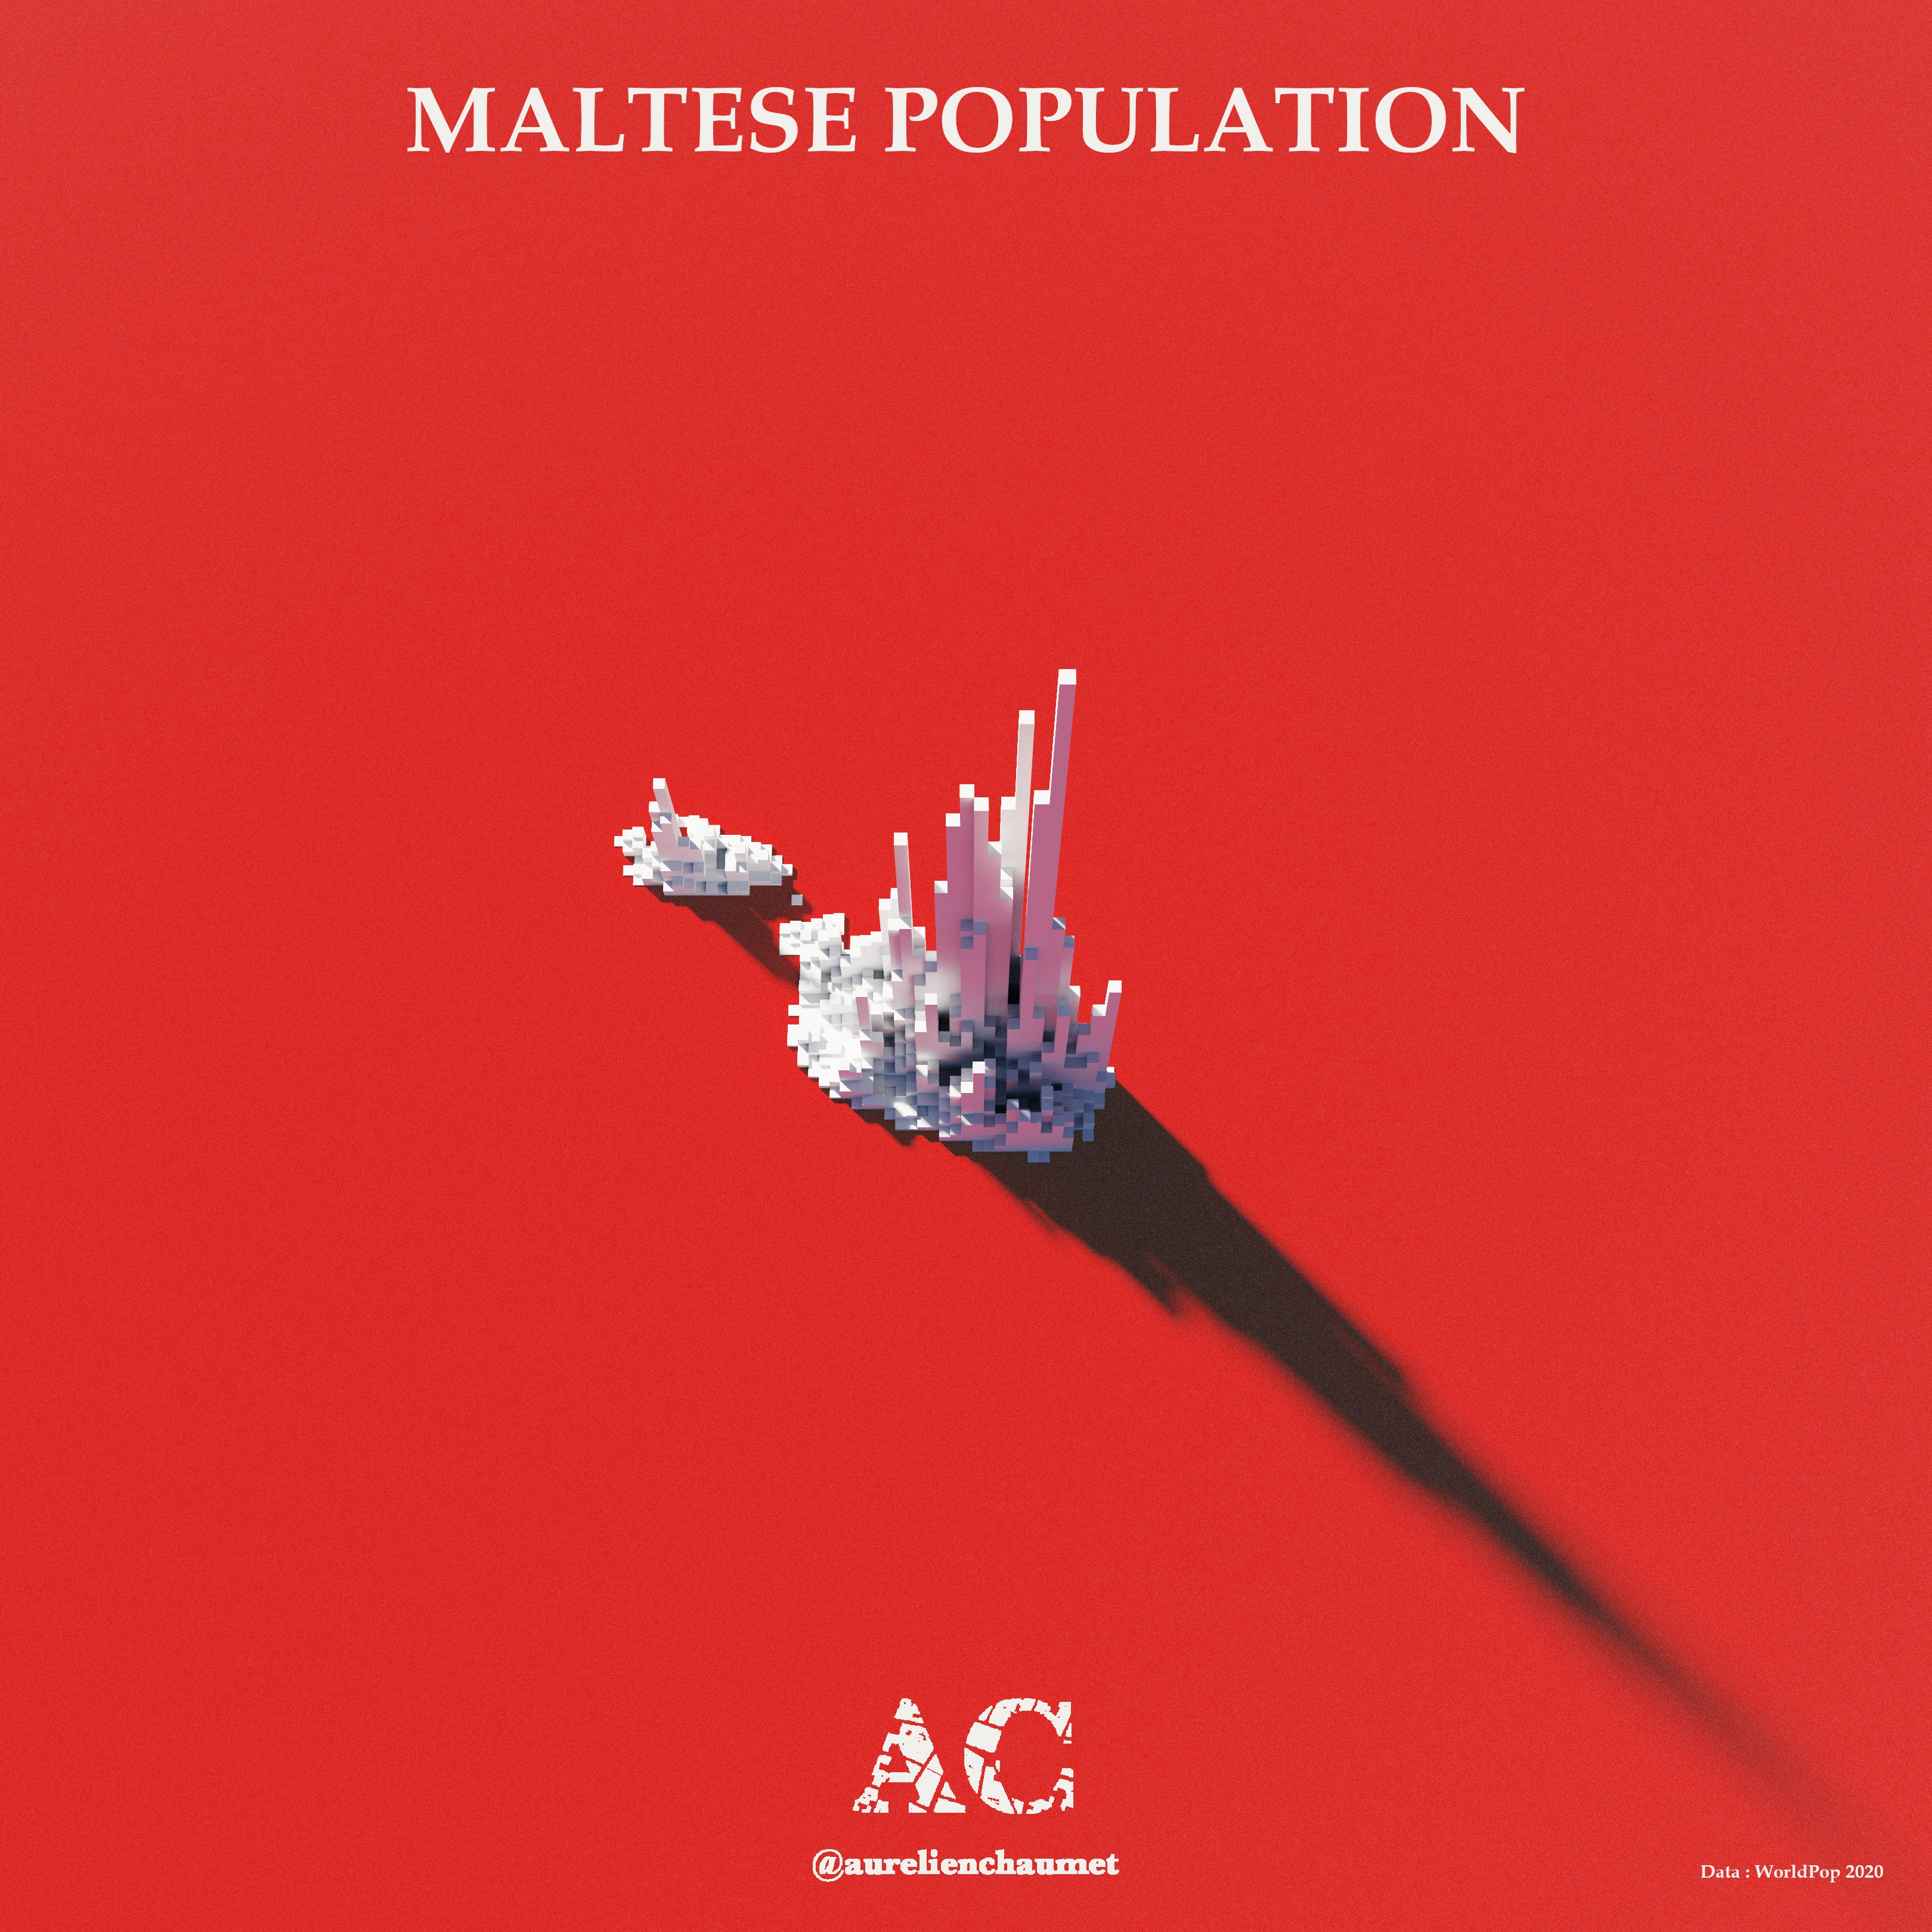
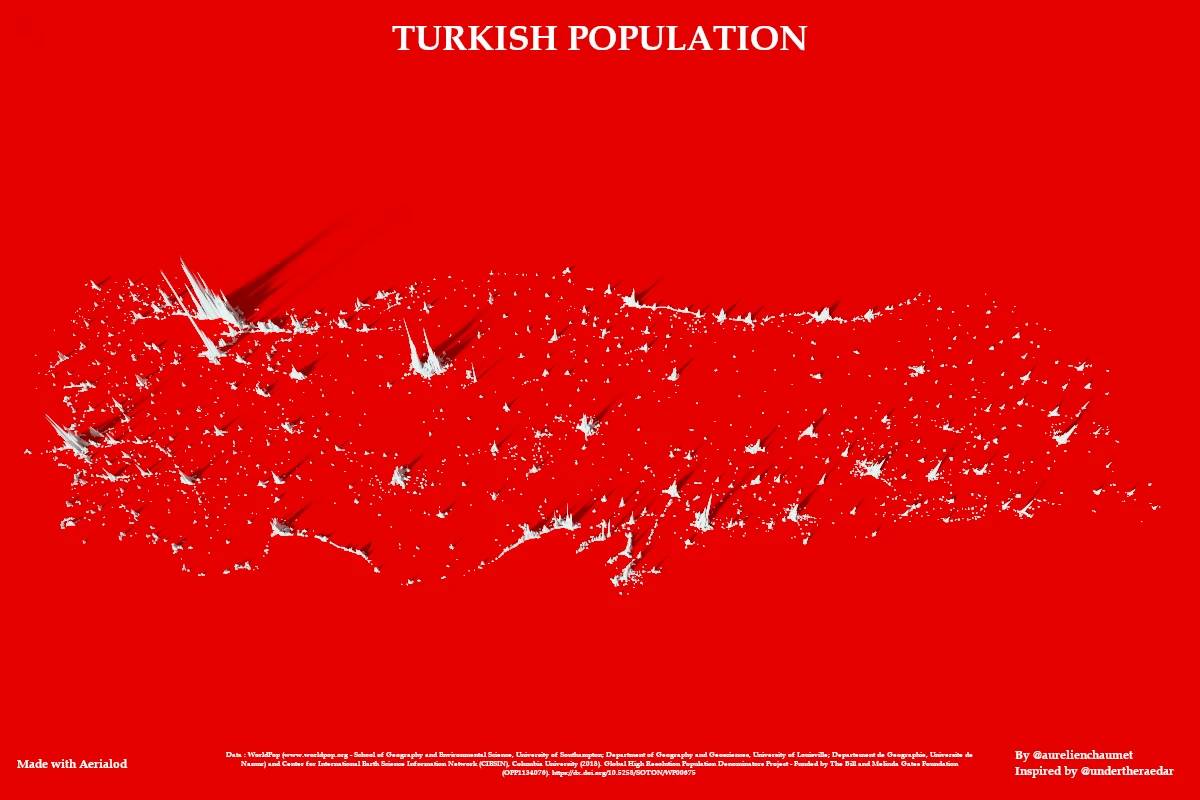
And here it is WorldPop ![]() !
!
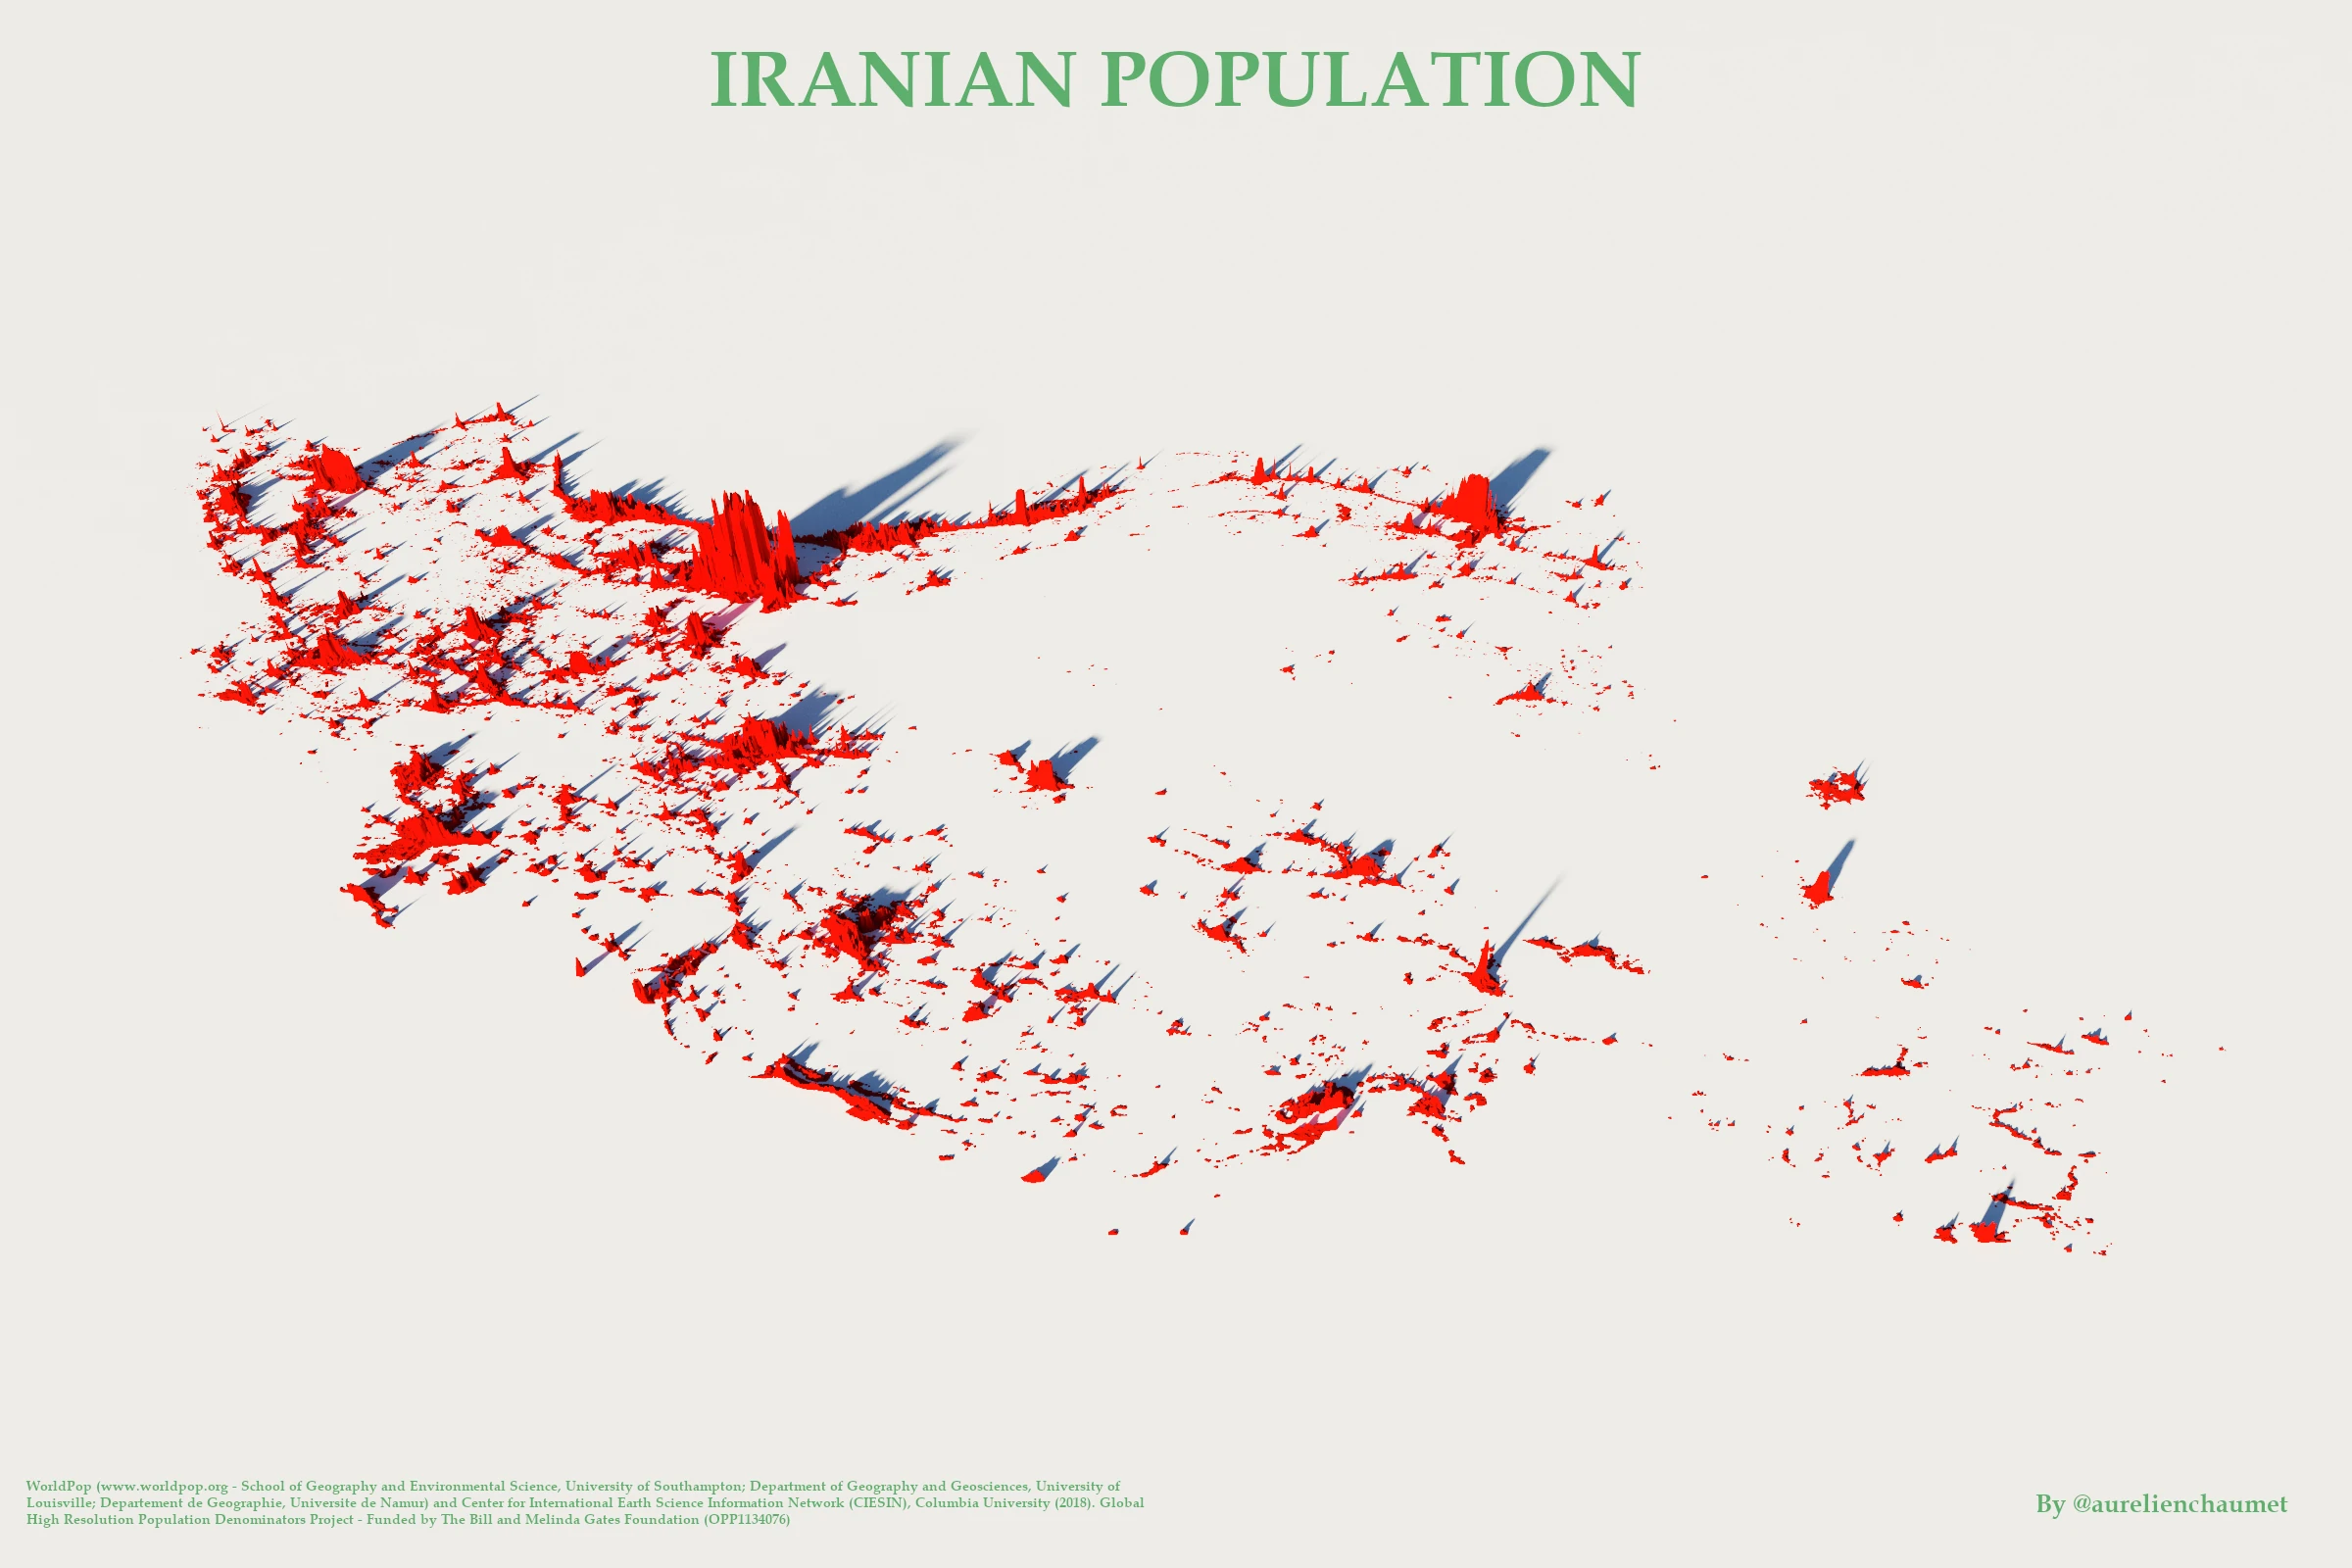
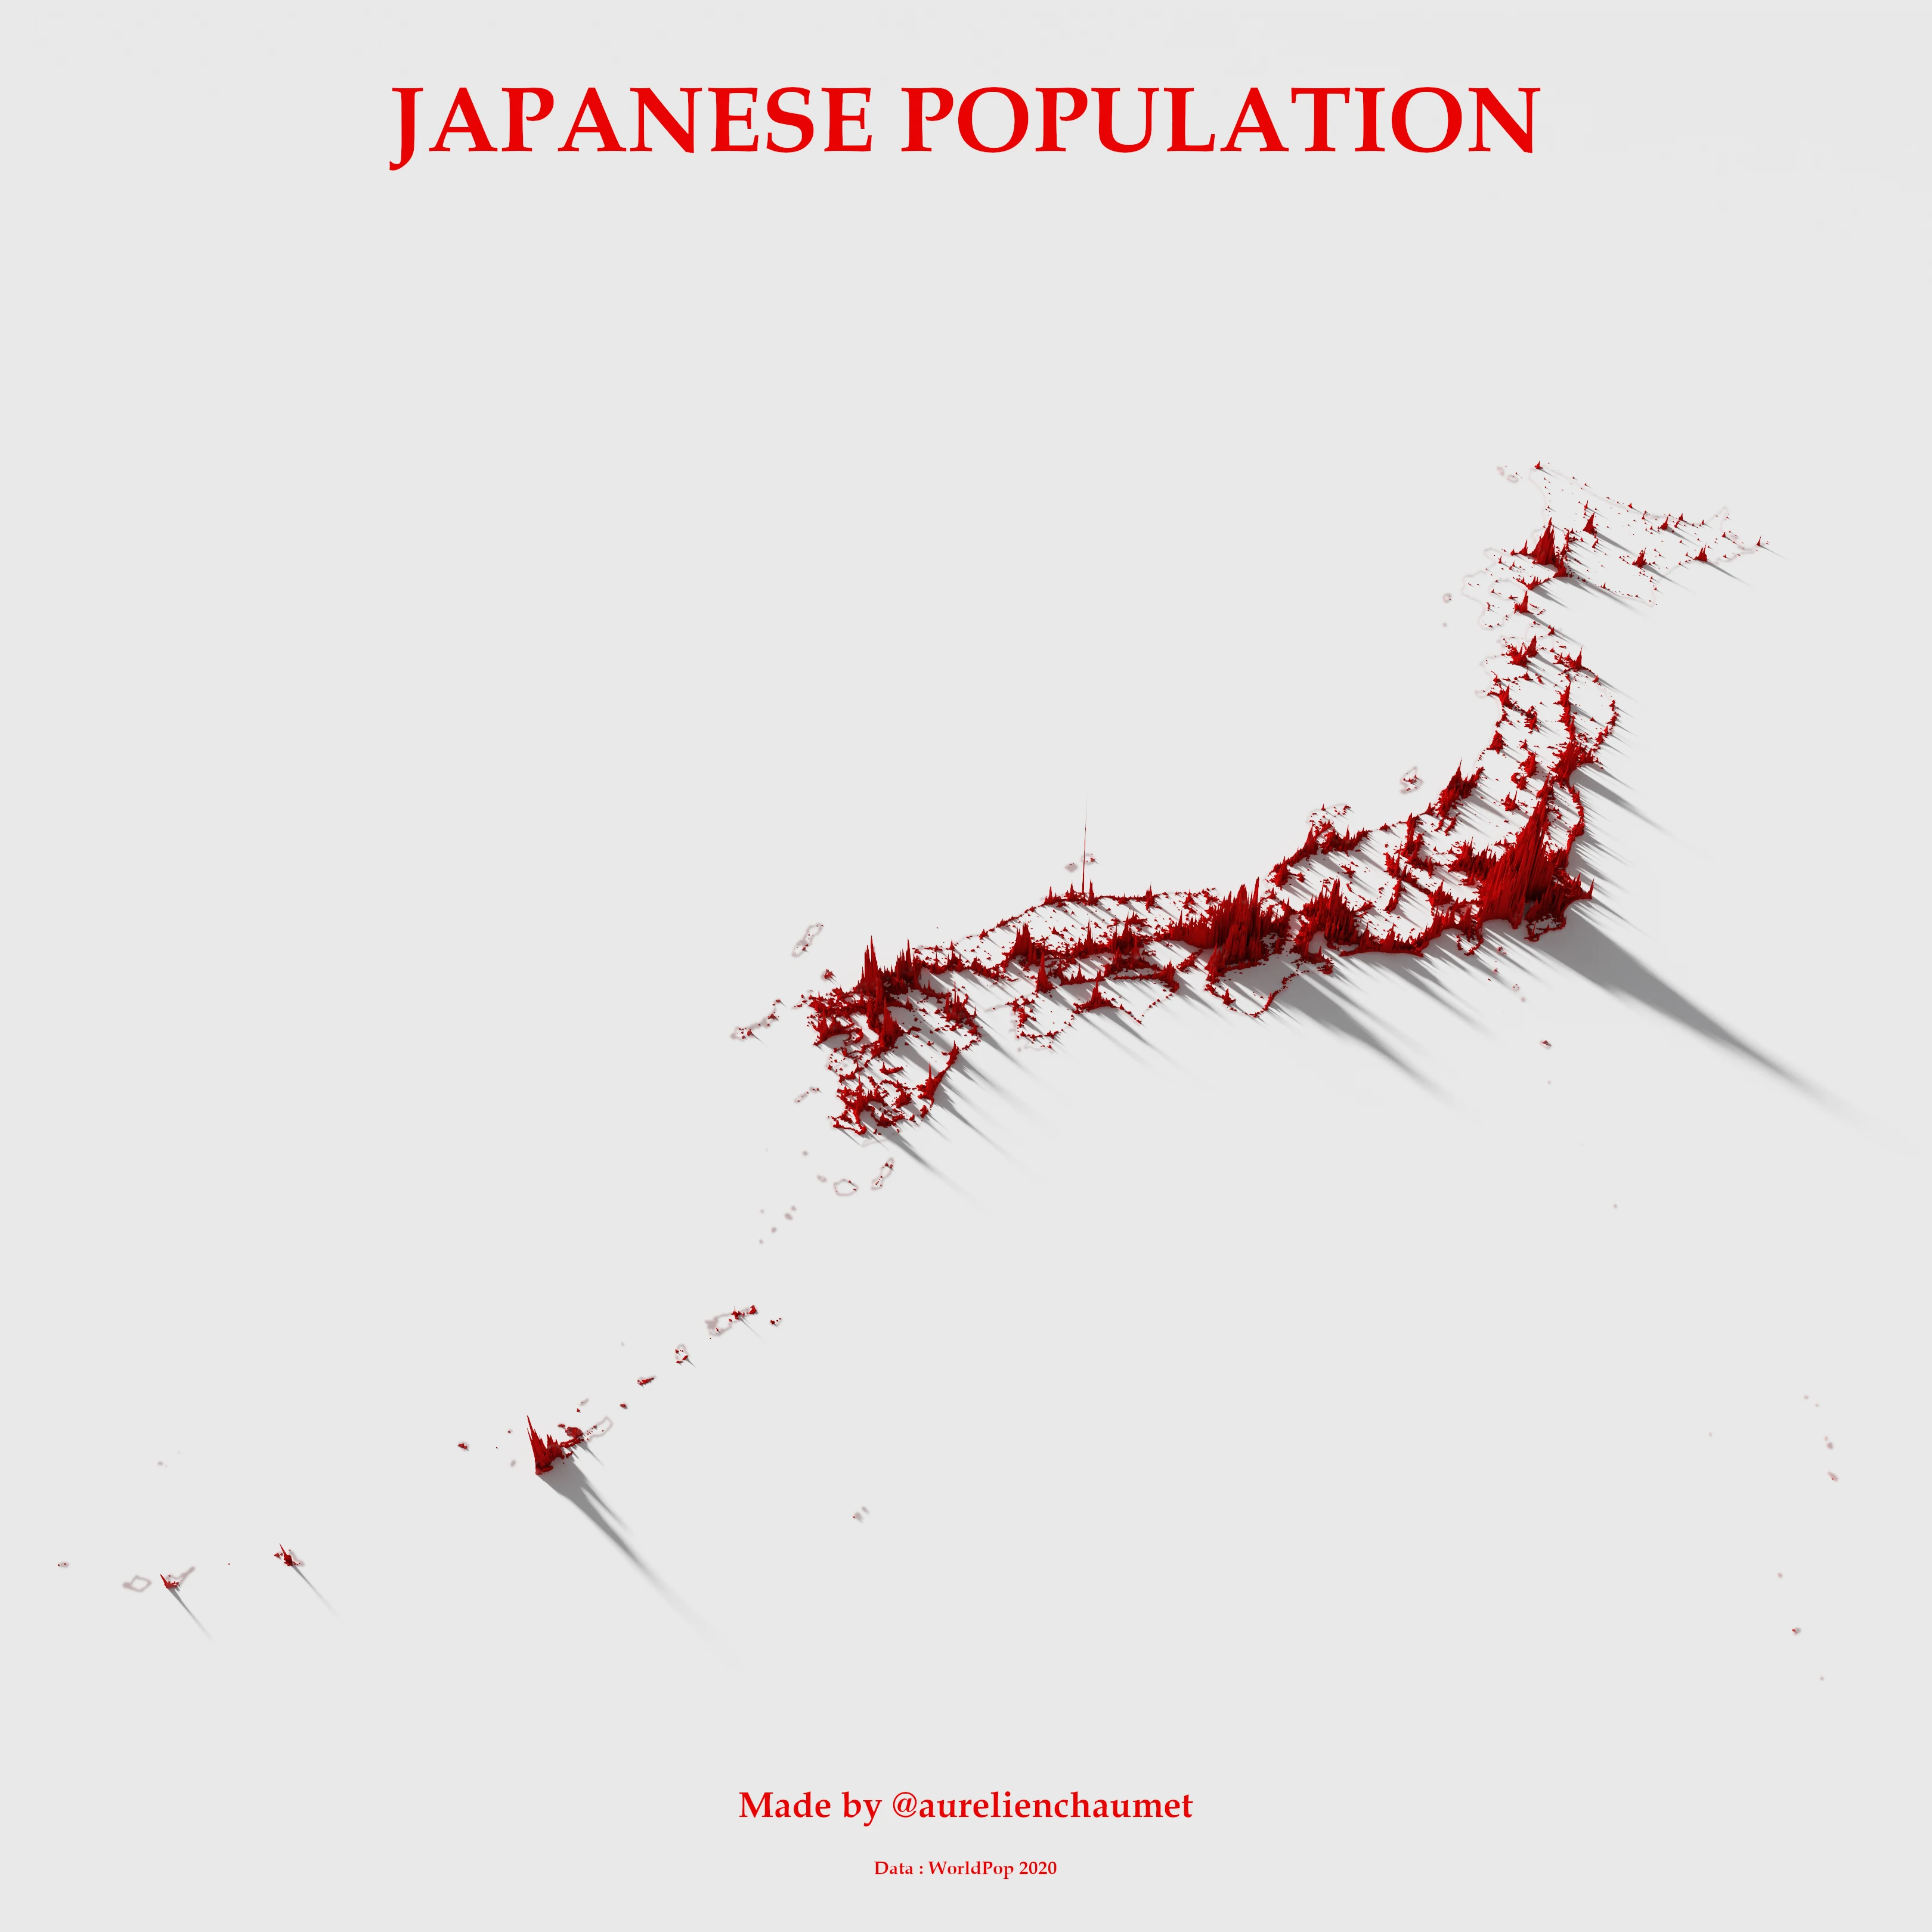
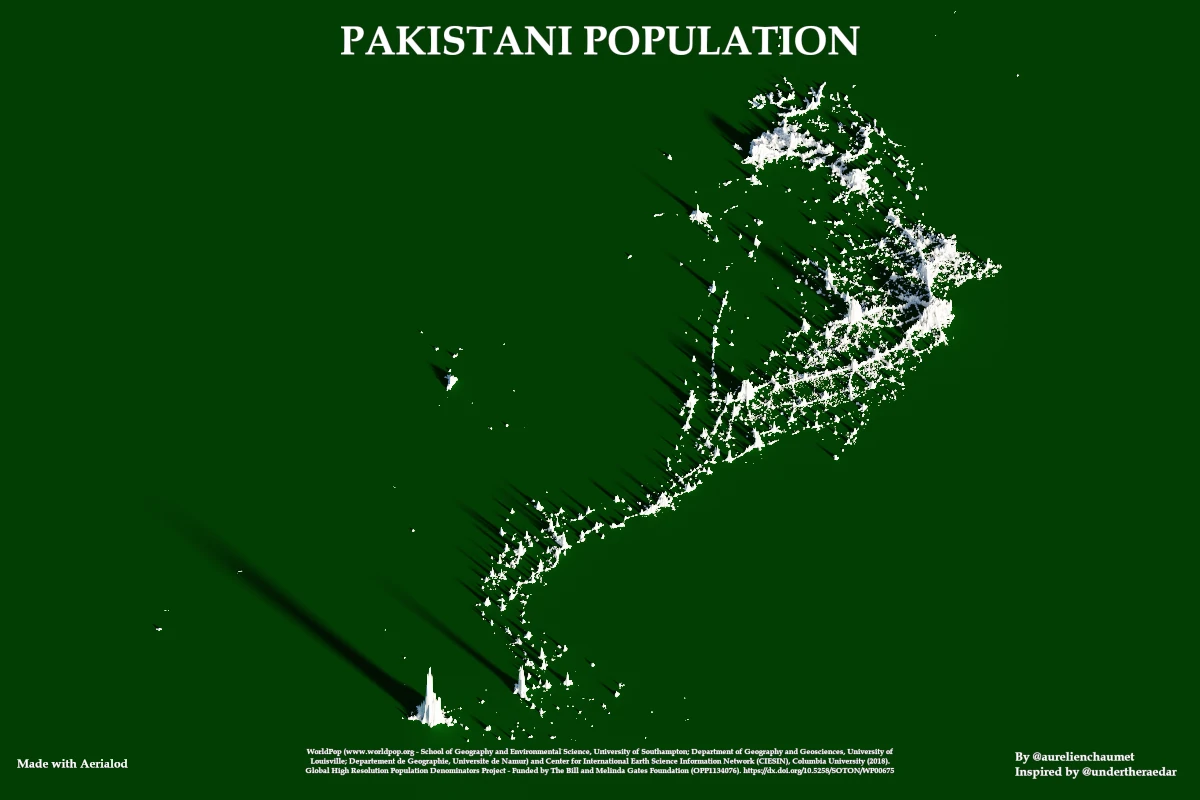
They have generated estimated population data over the last 10 years, mainly through satellite images, on parts of the globe which are, in general, the least endowed with this point of view.
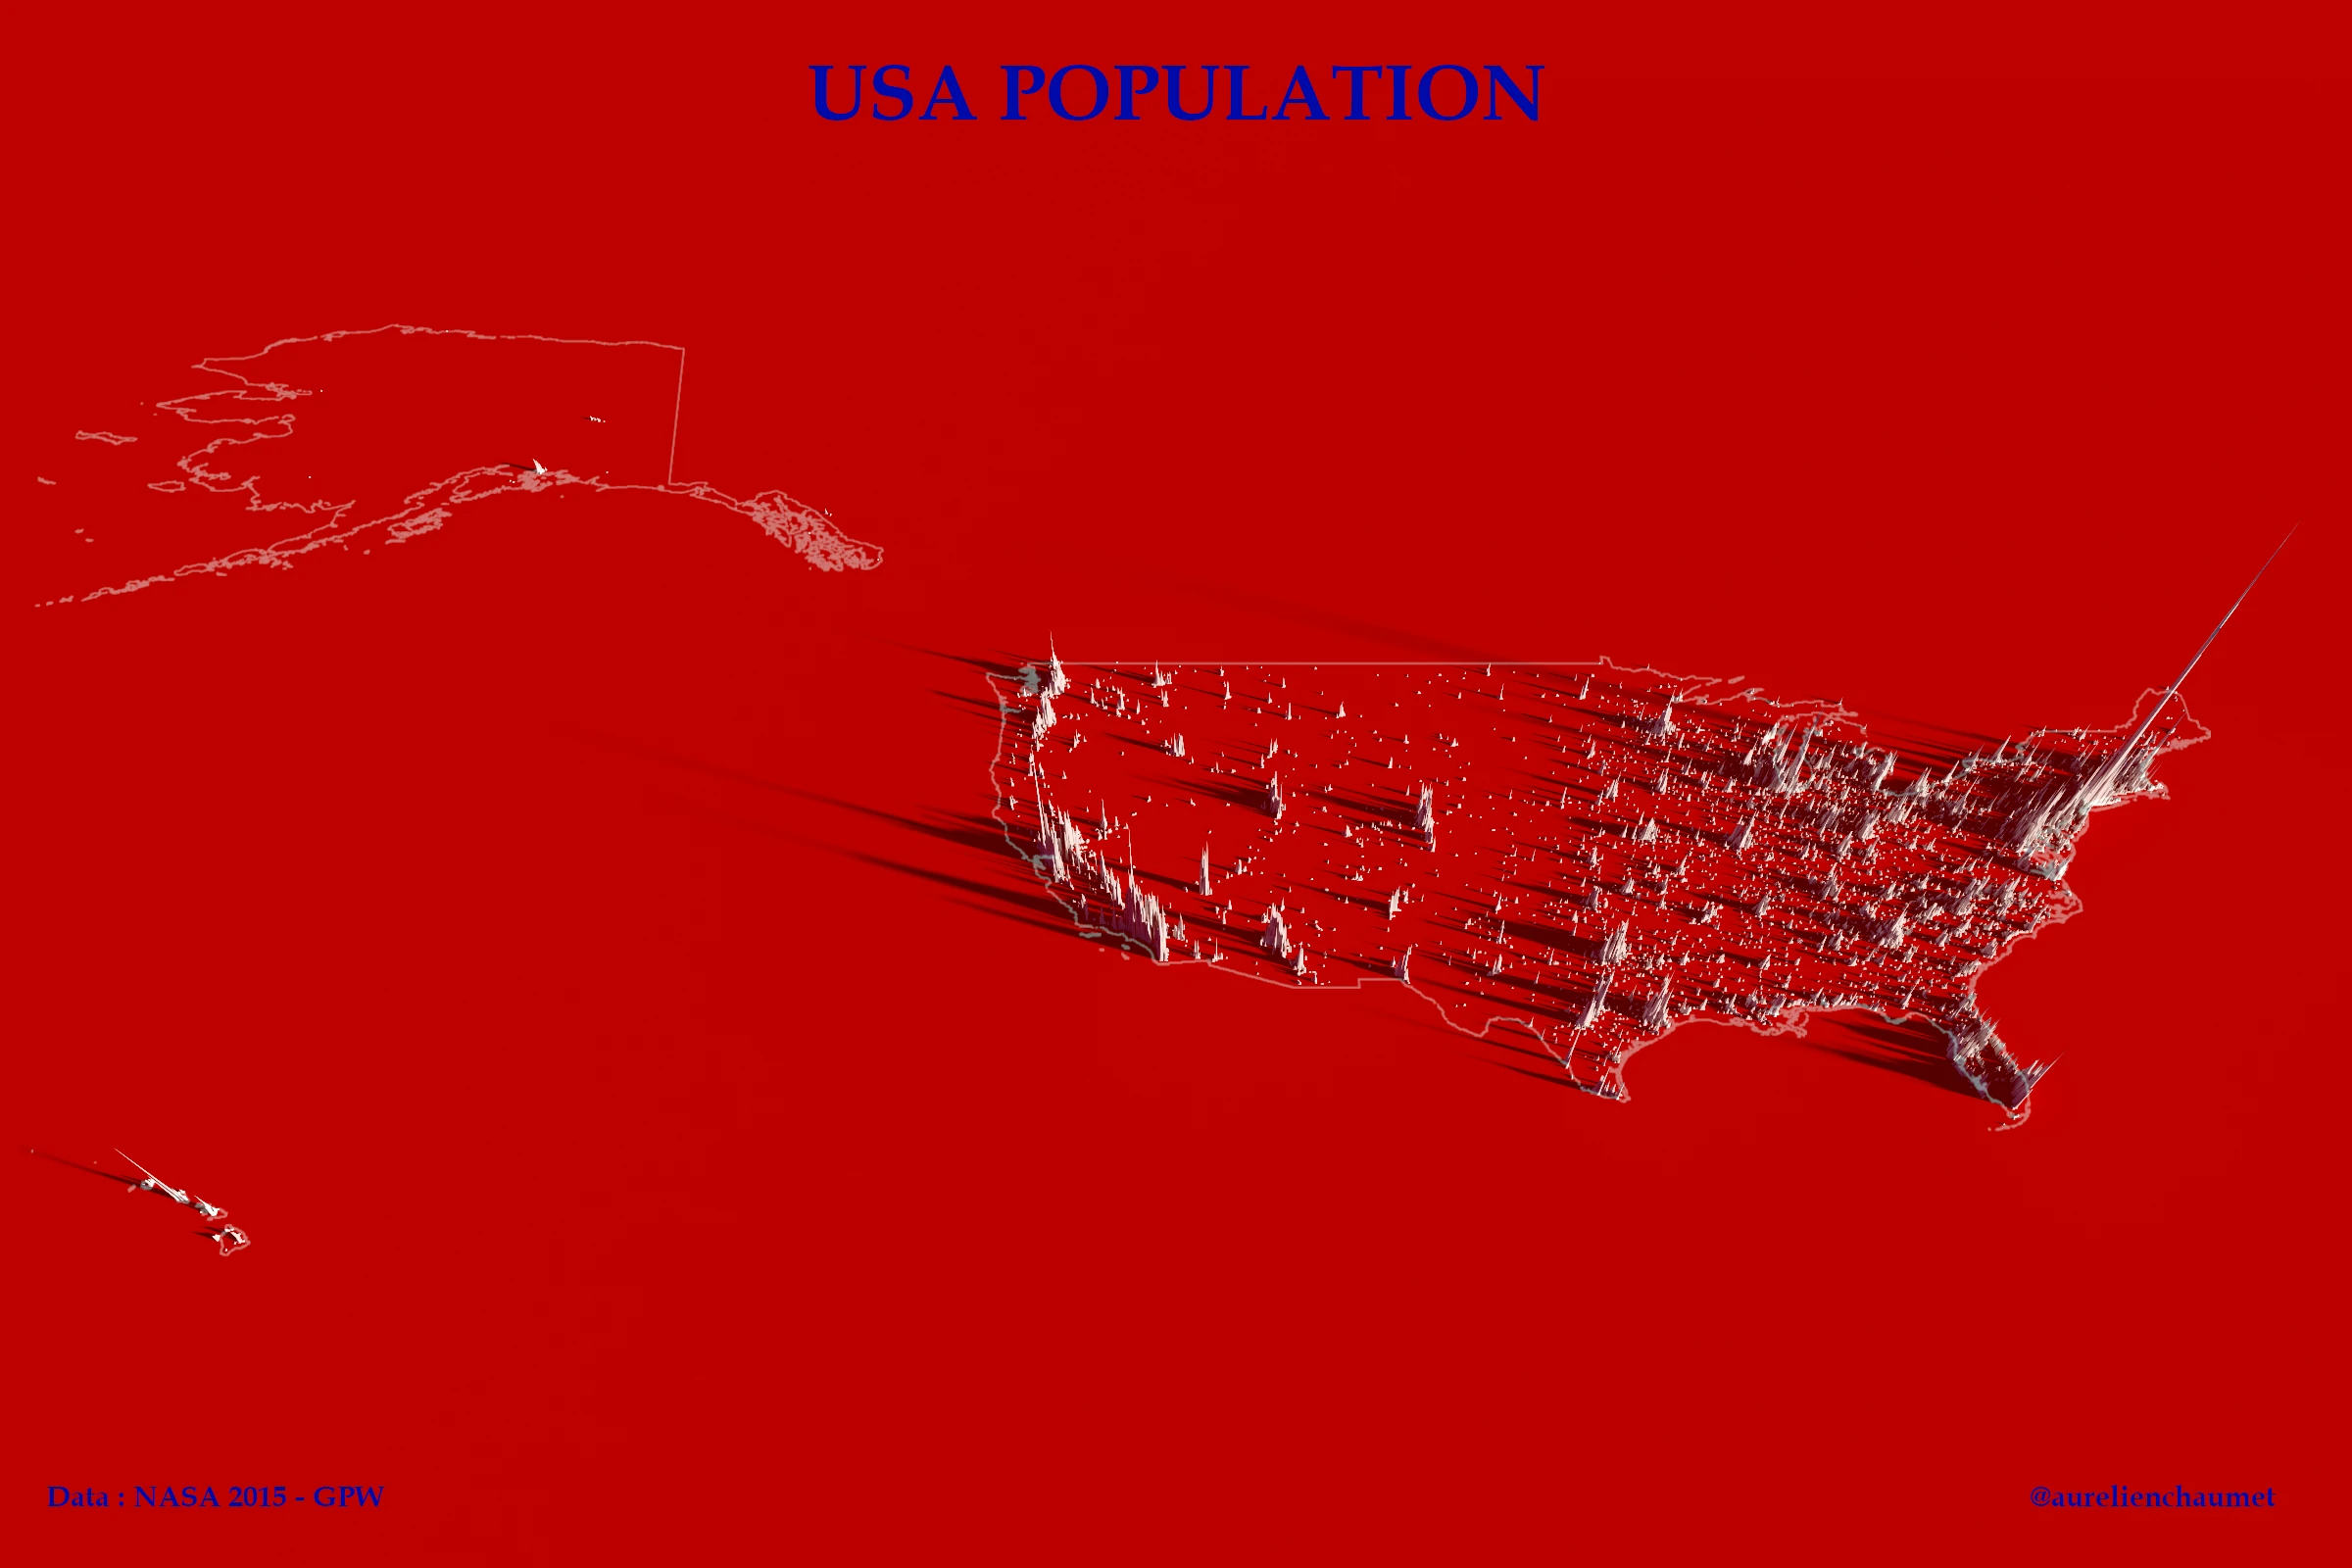
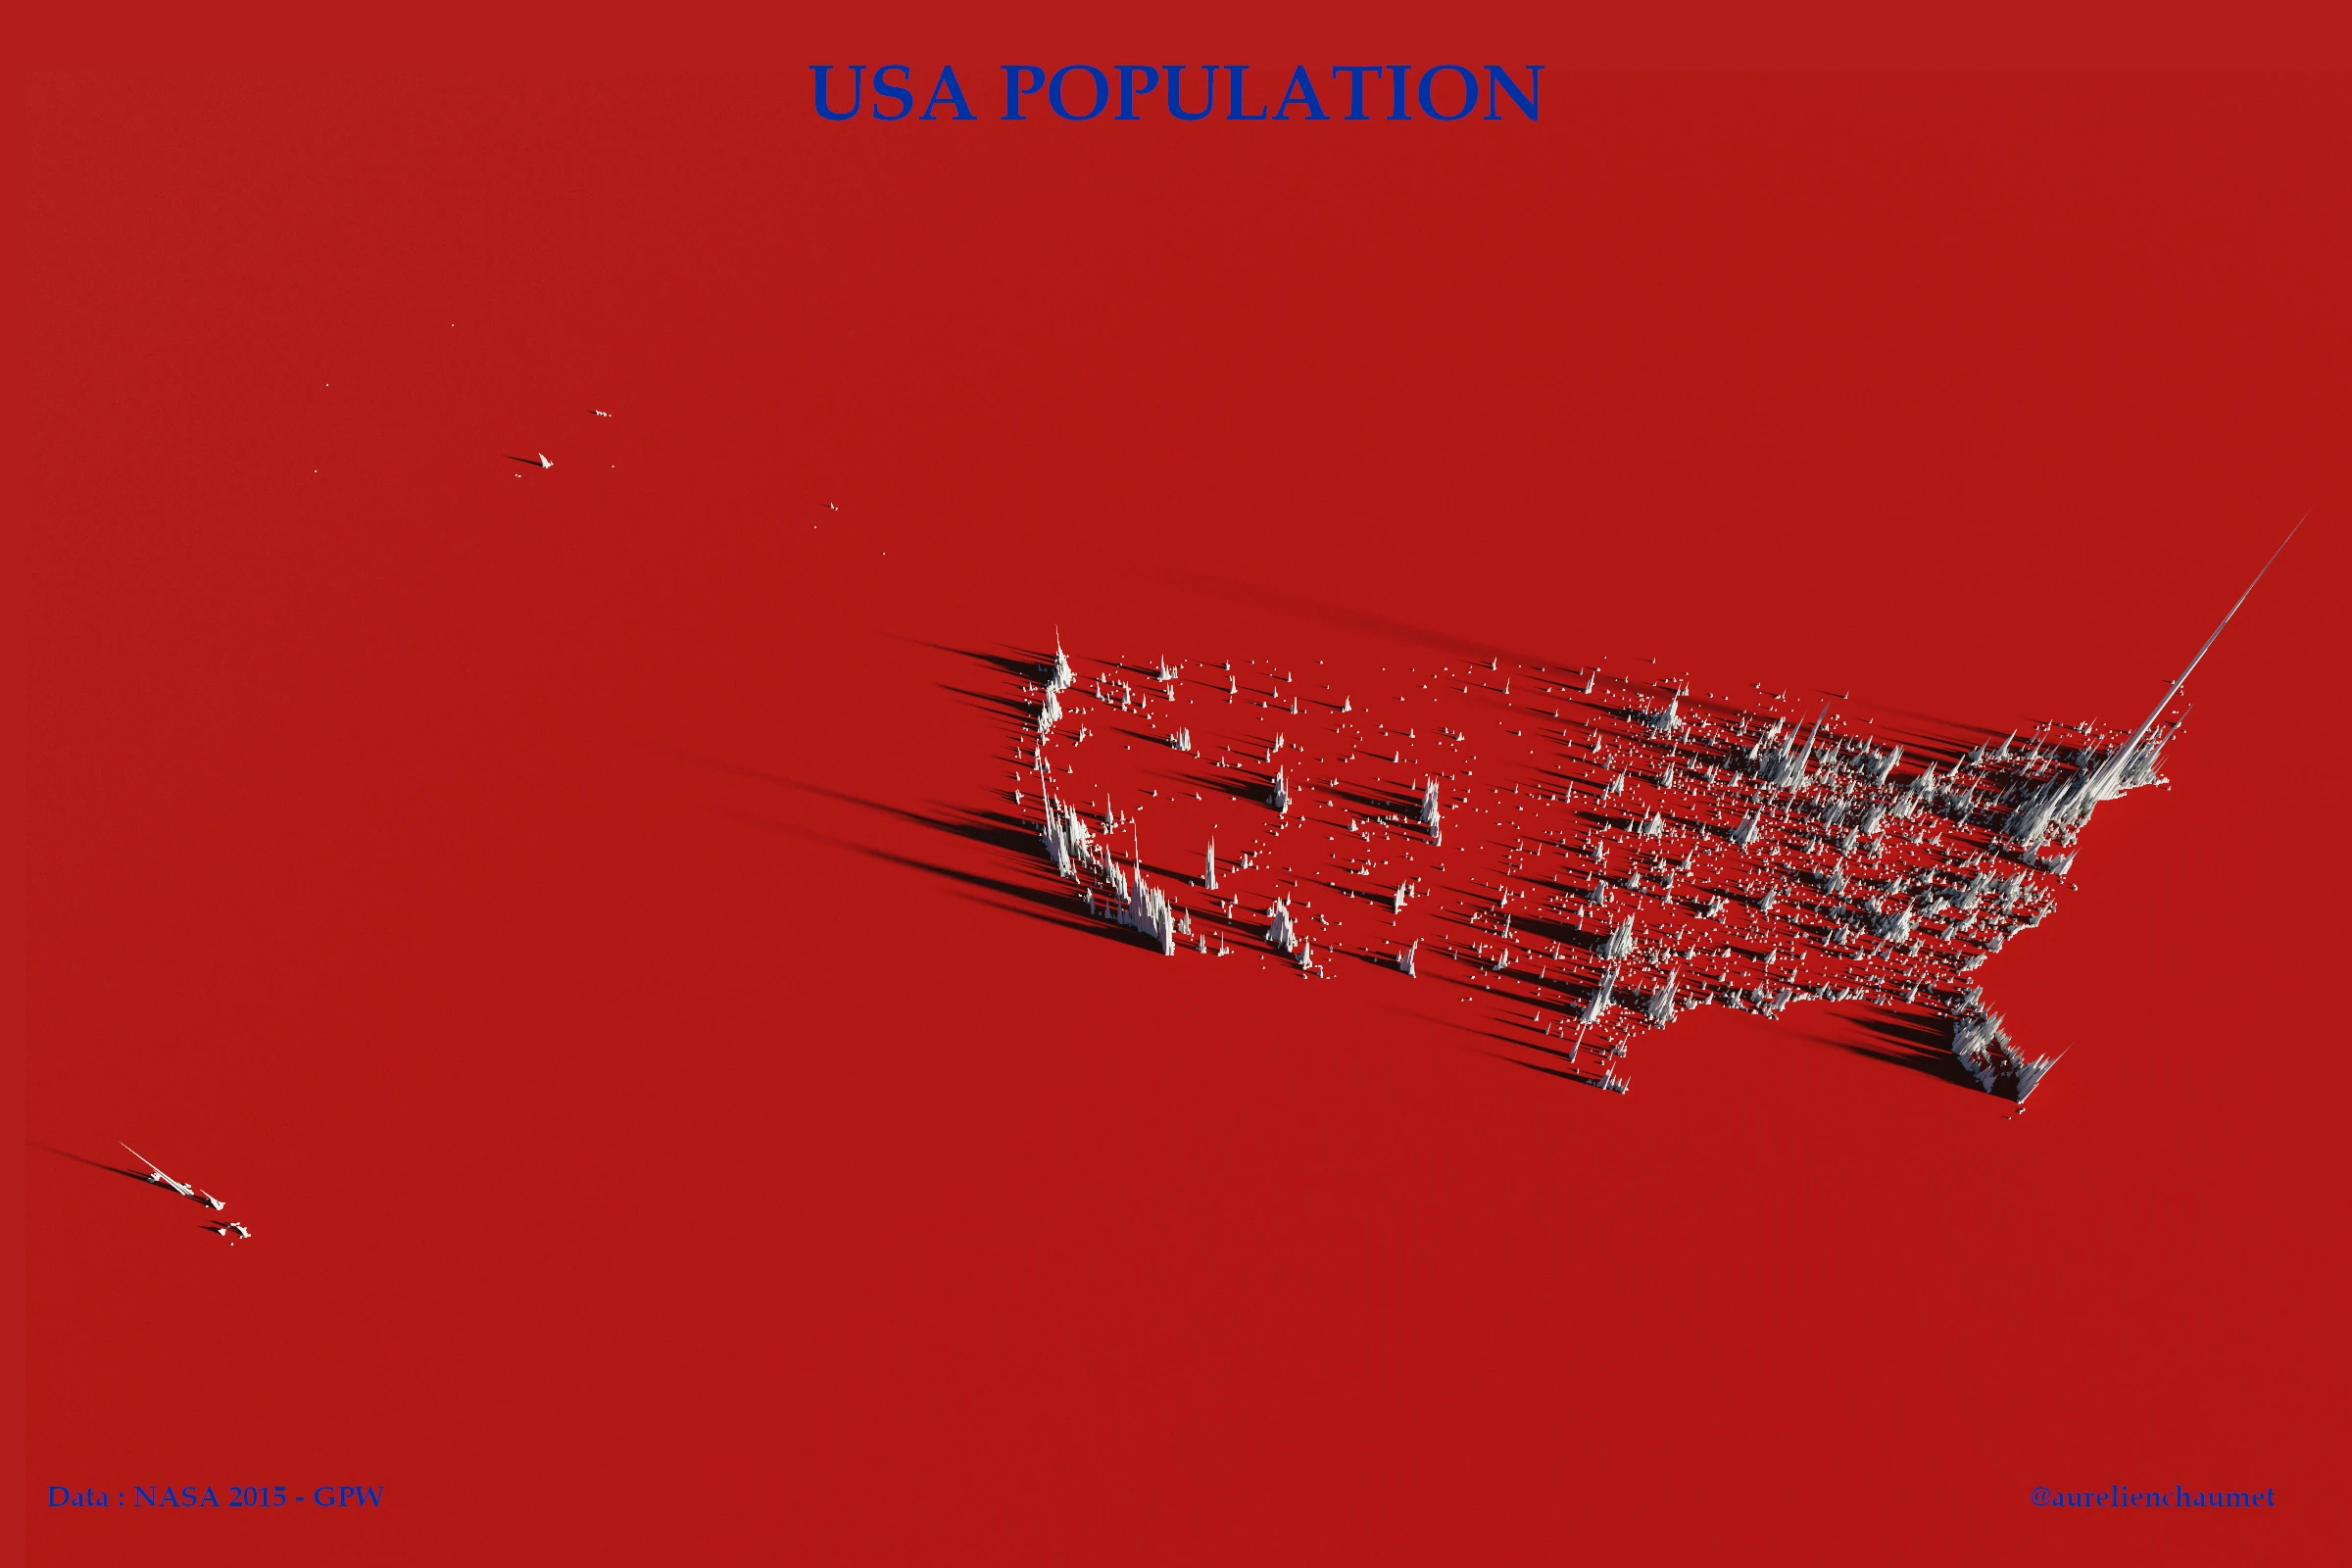
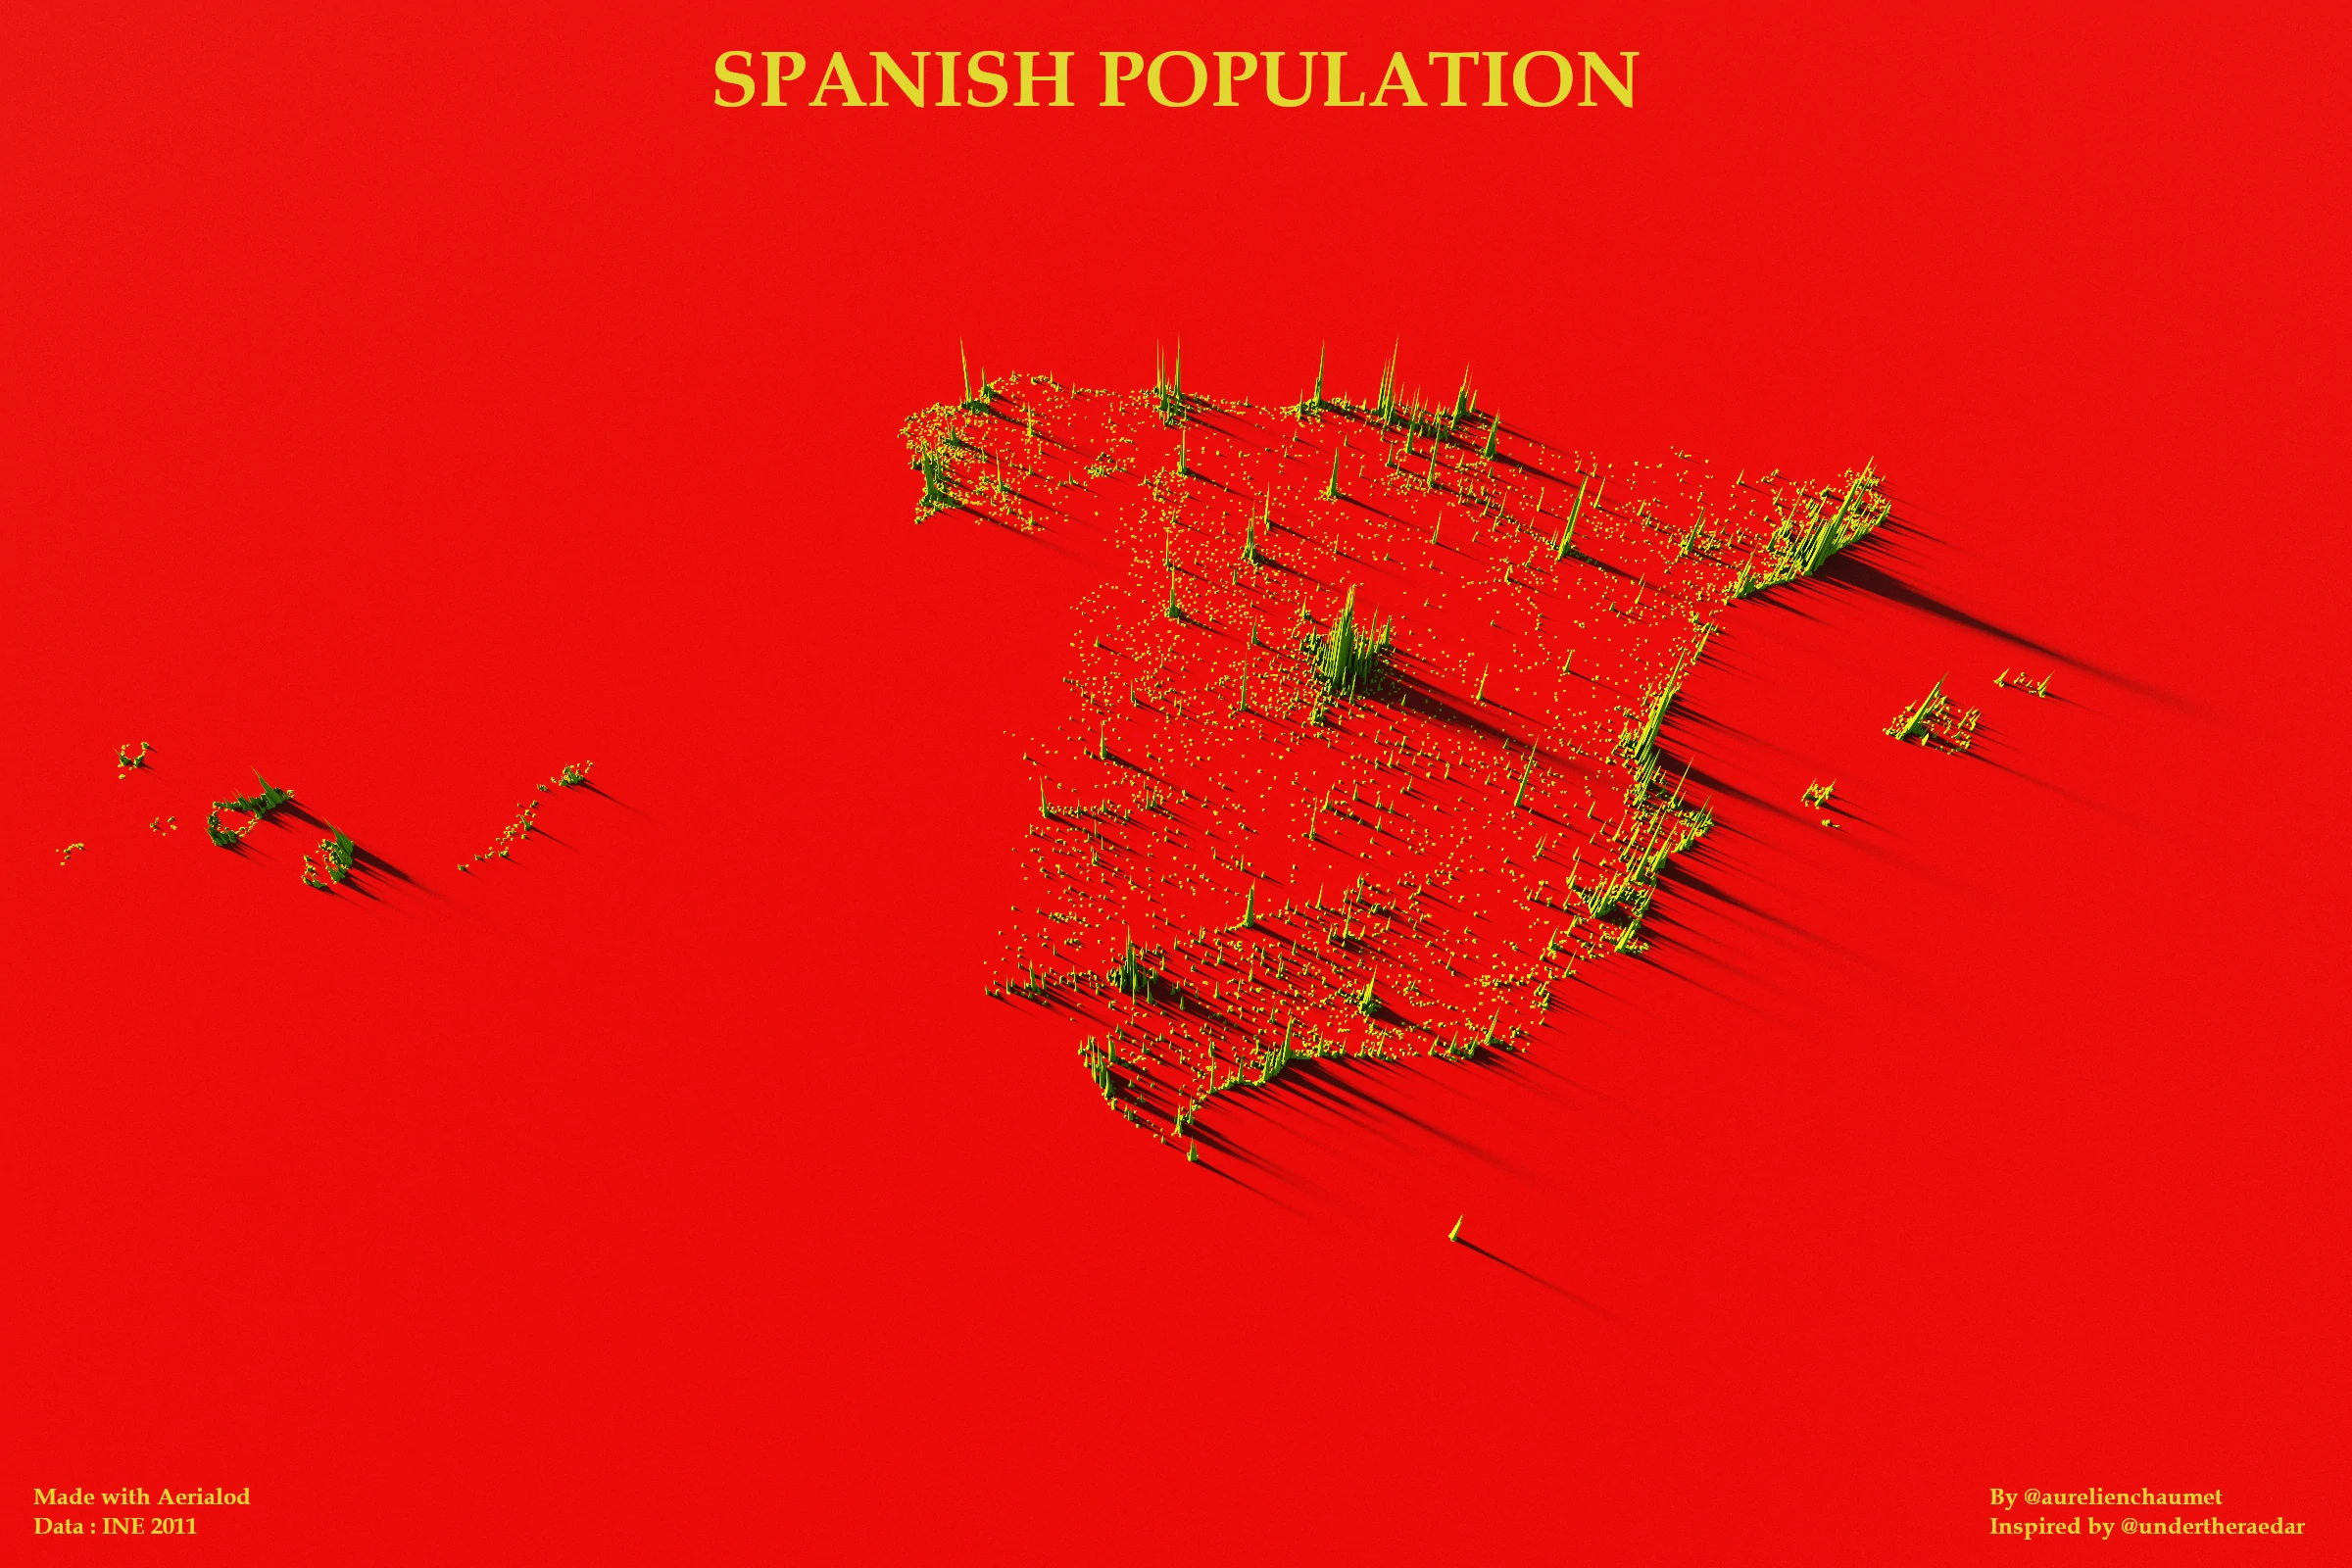
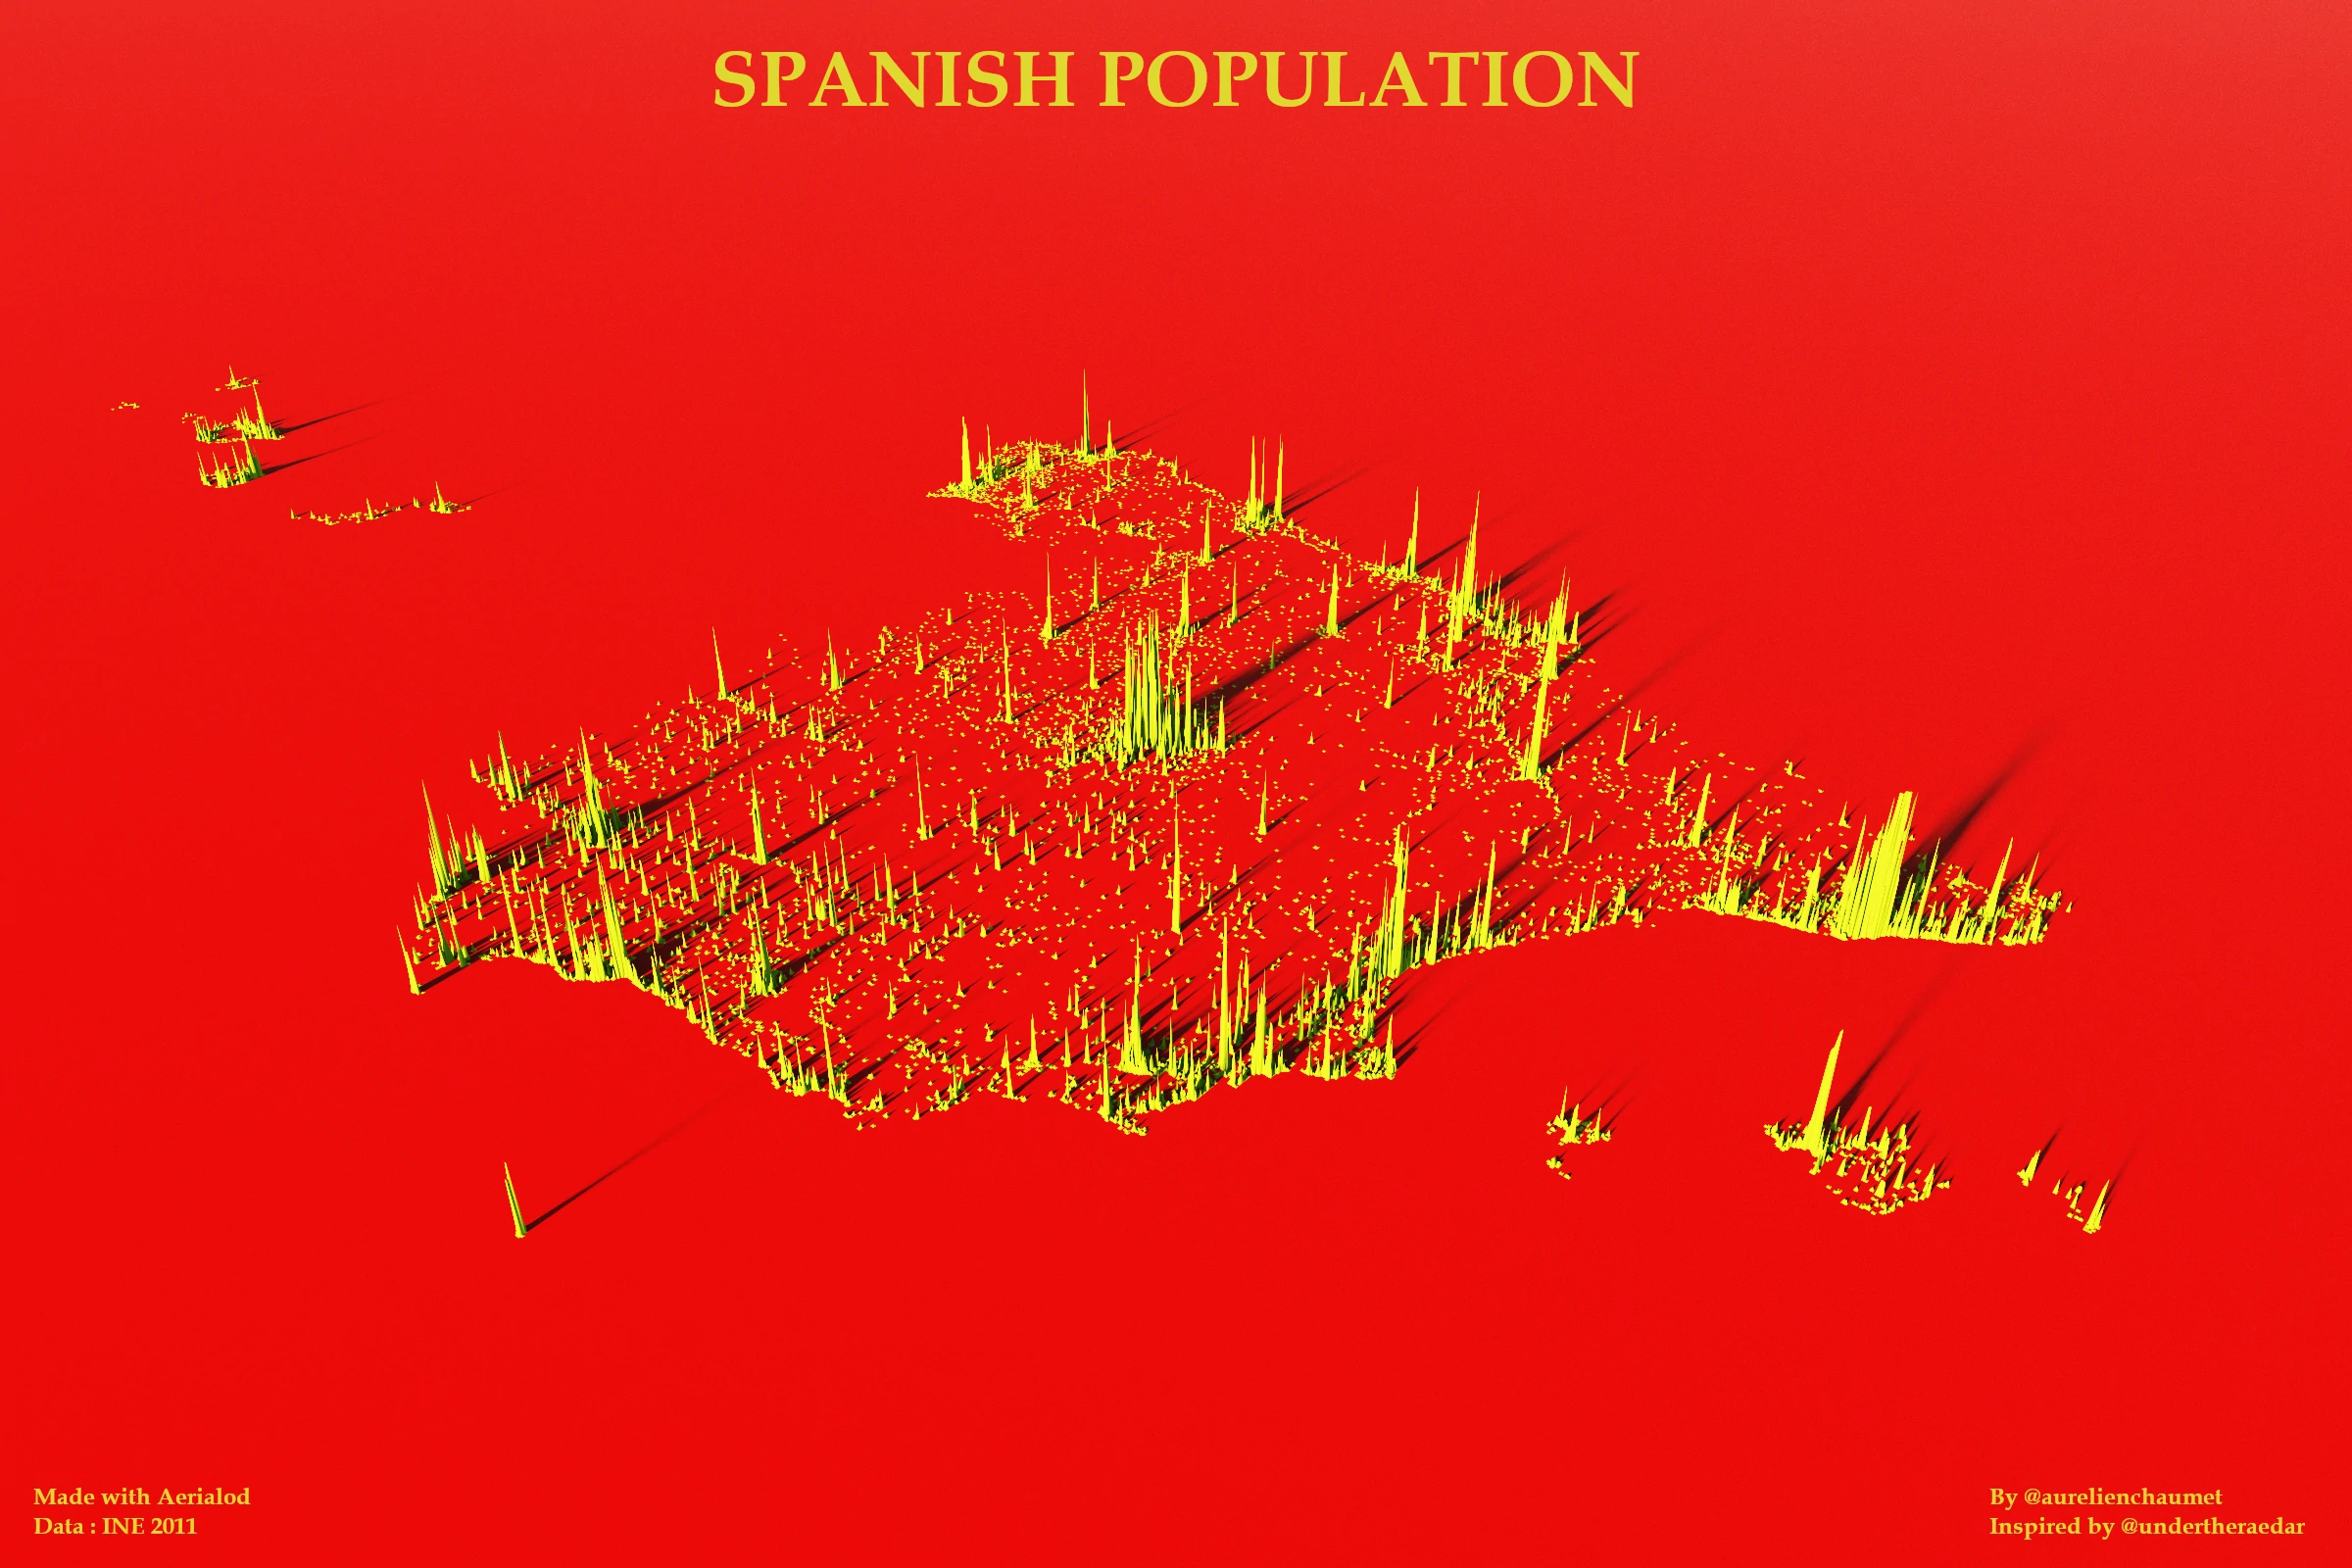
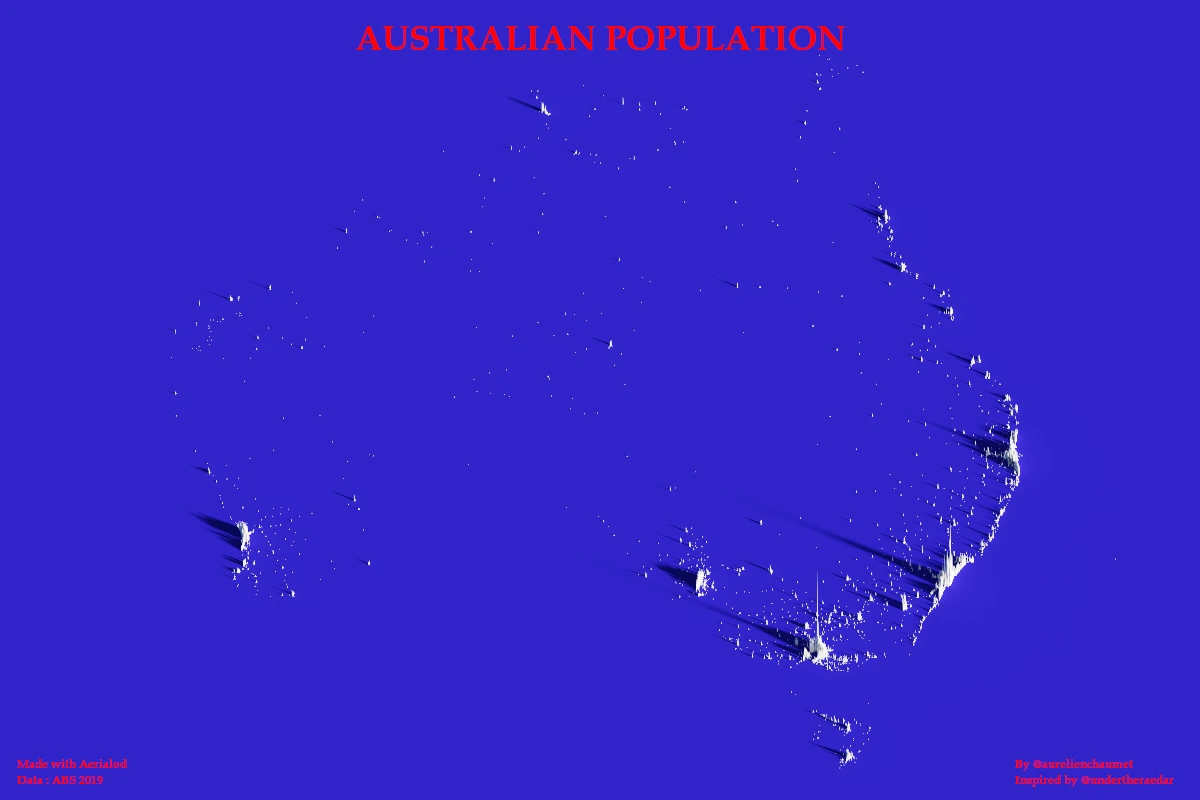
As mentioned above, you will find below all the peak population maps that I have been able to make so far.
Feel free to make me some feedbacks on Twitter or directly in the comments at the bottom of this page !
America


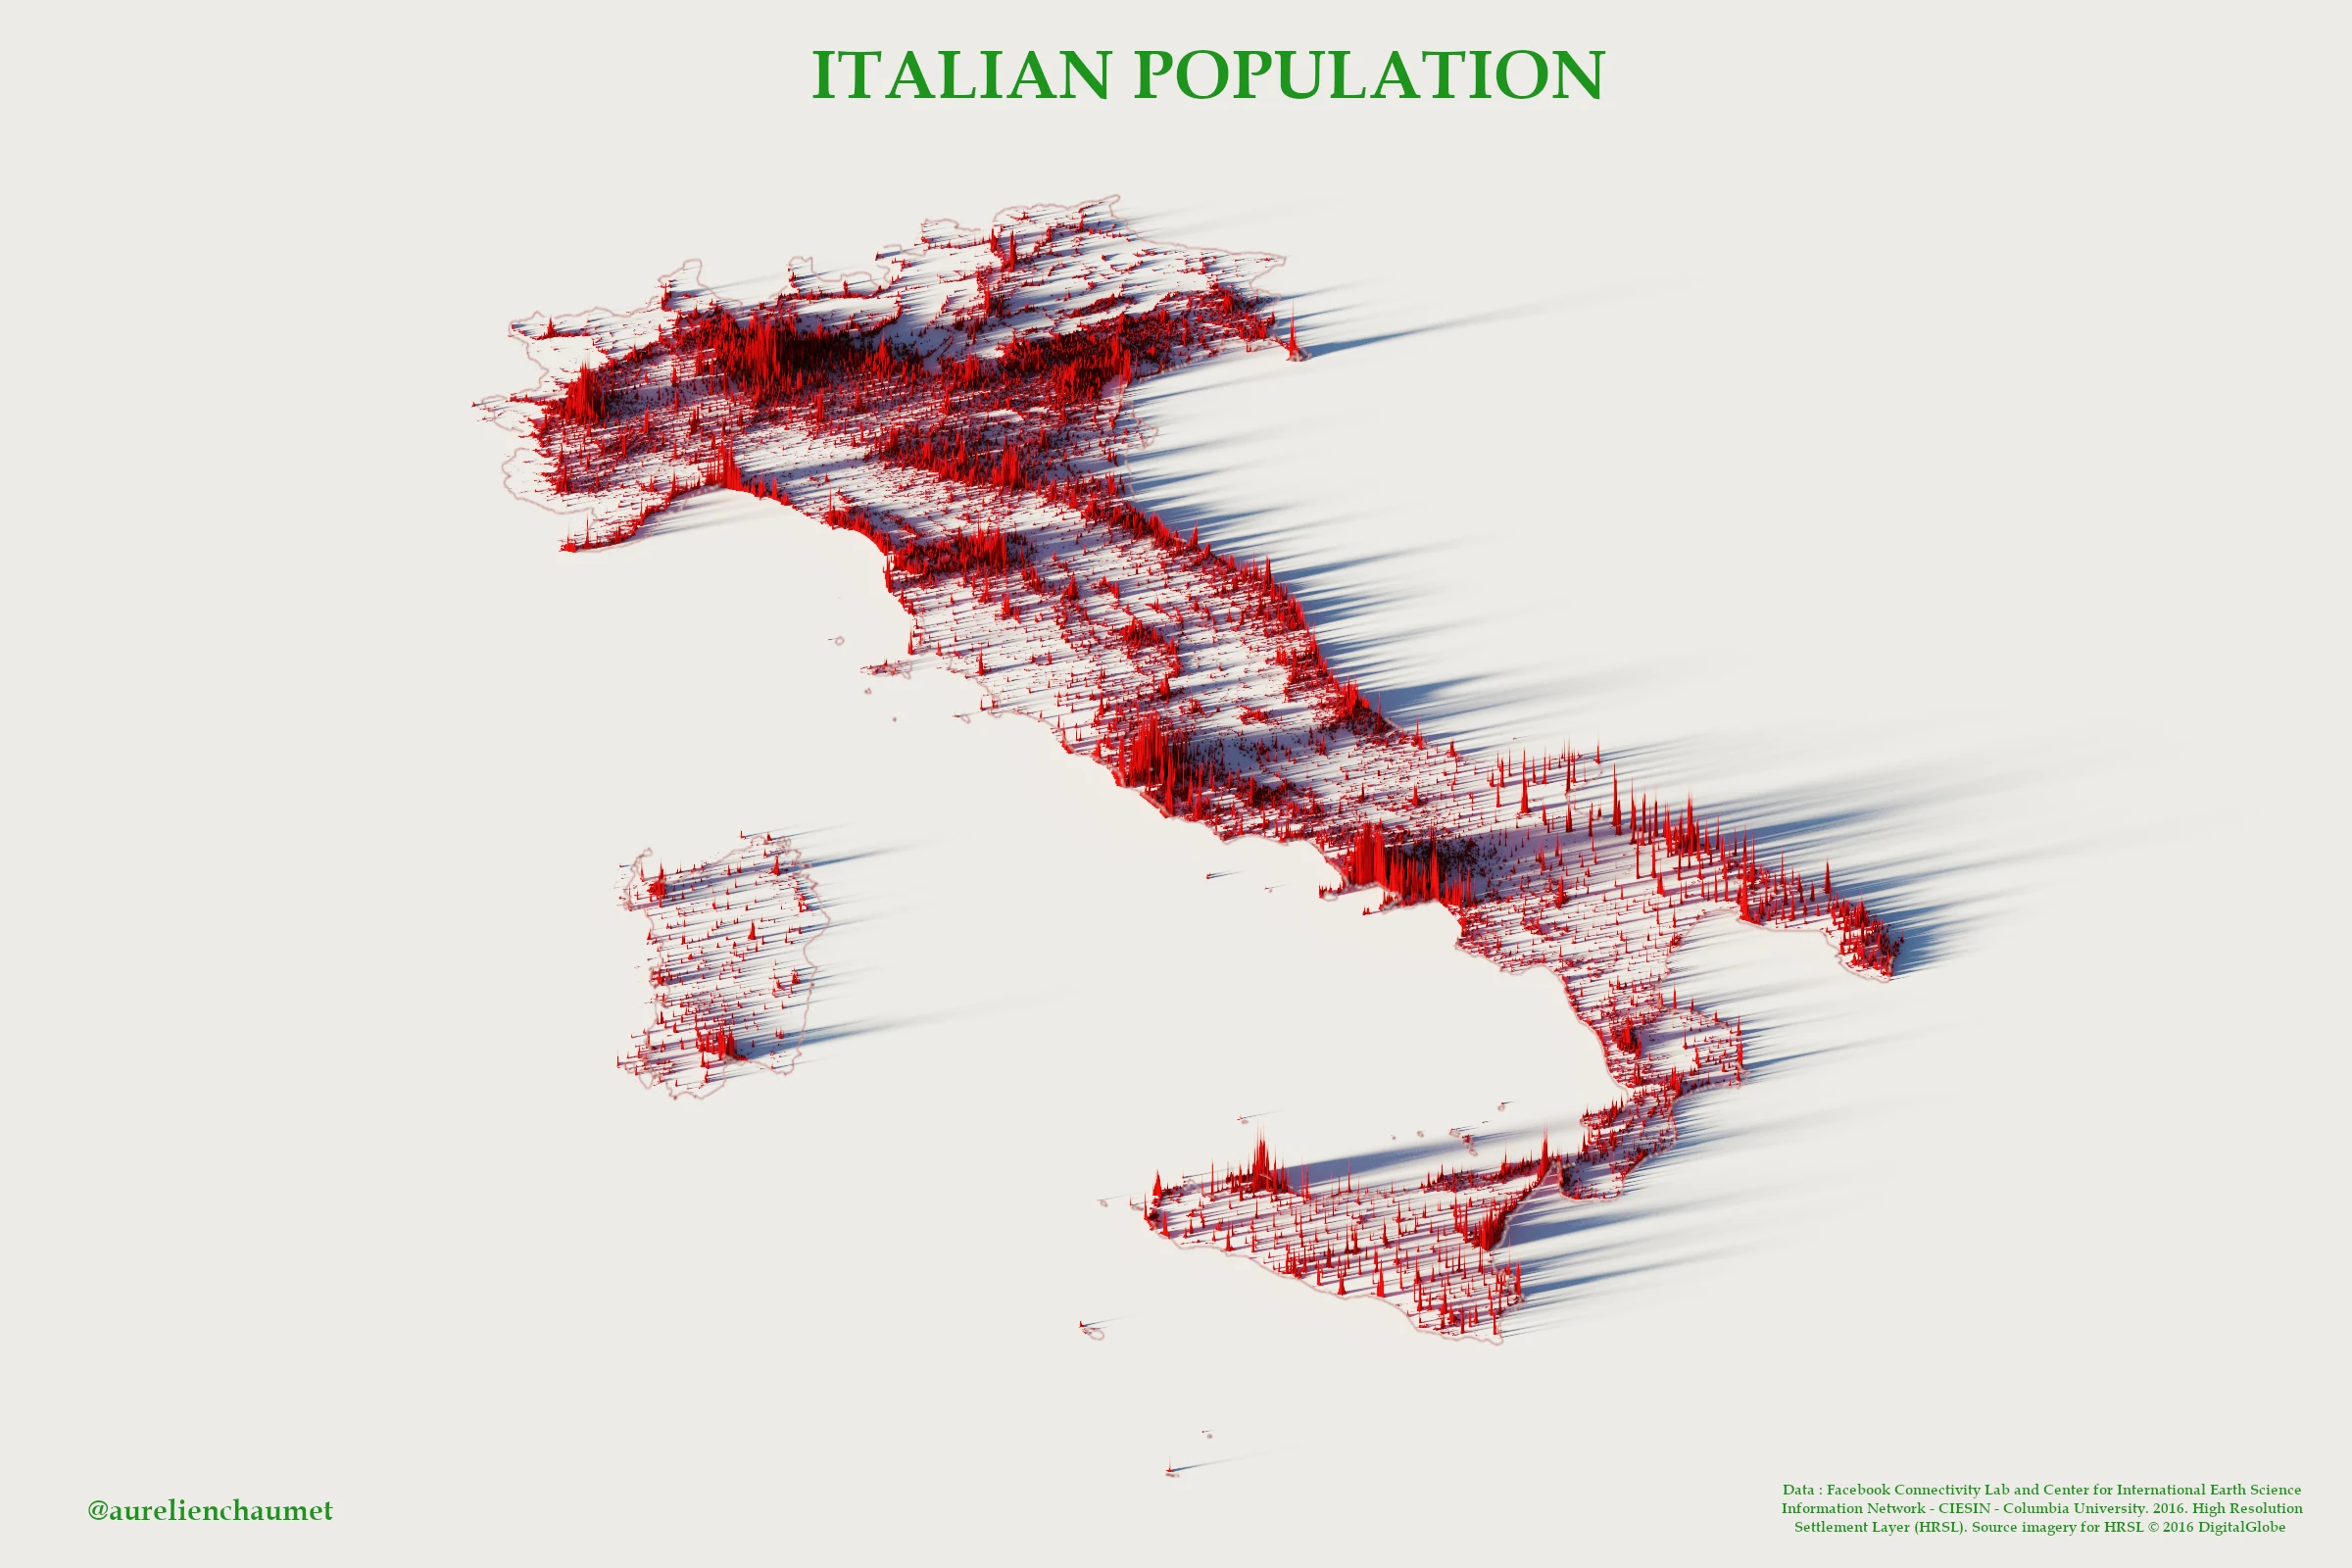
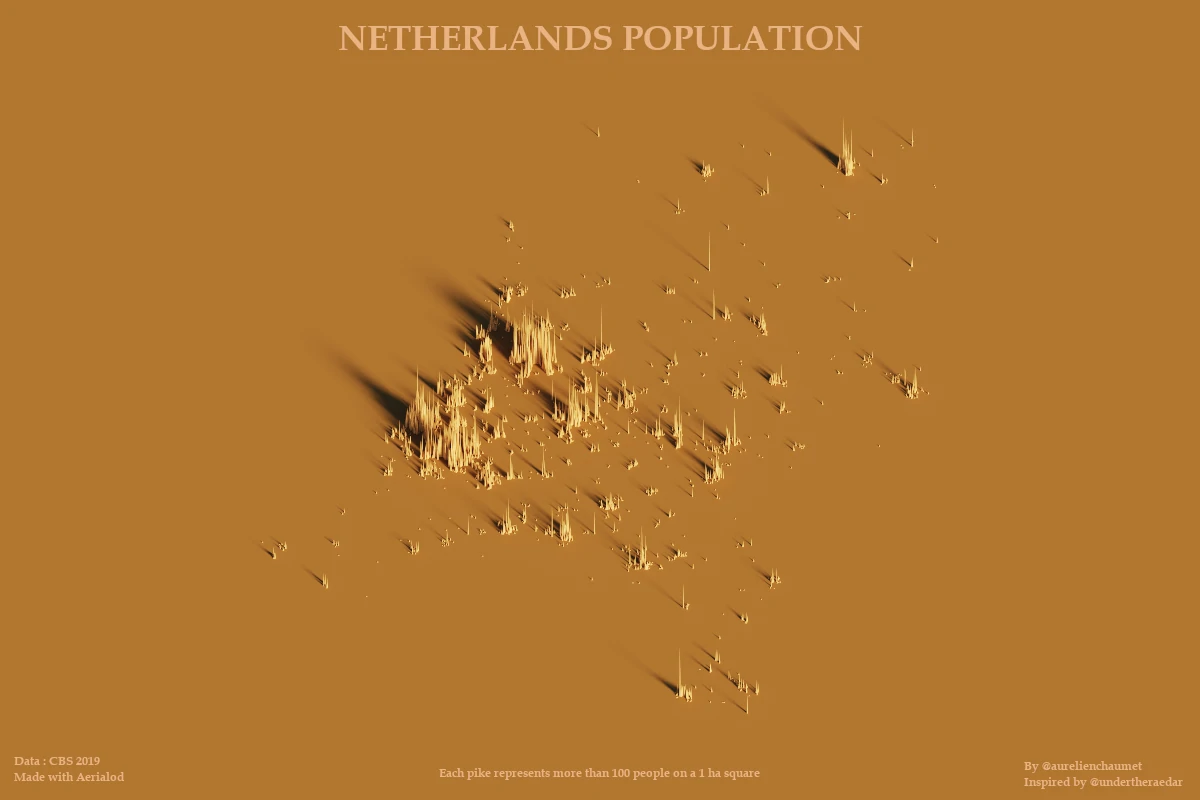
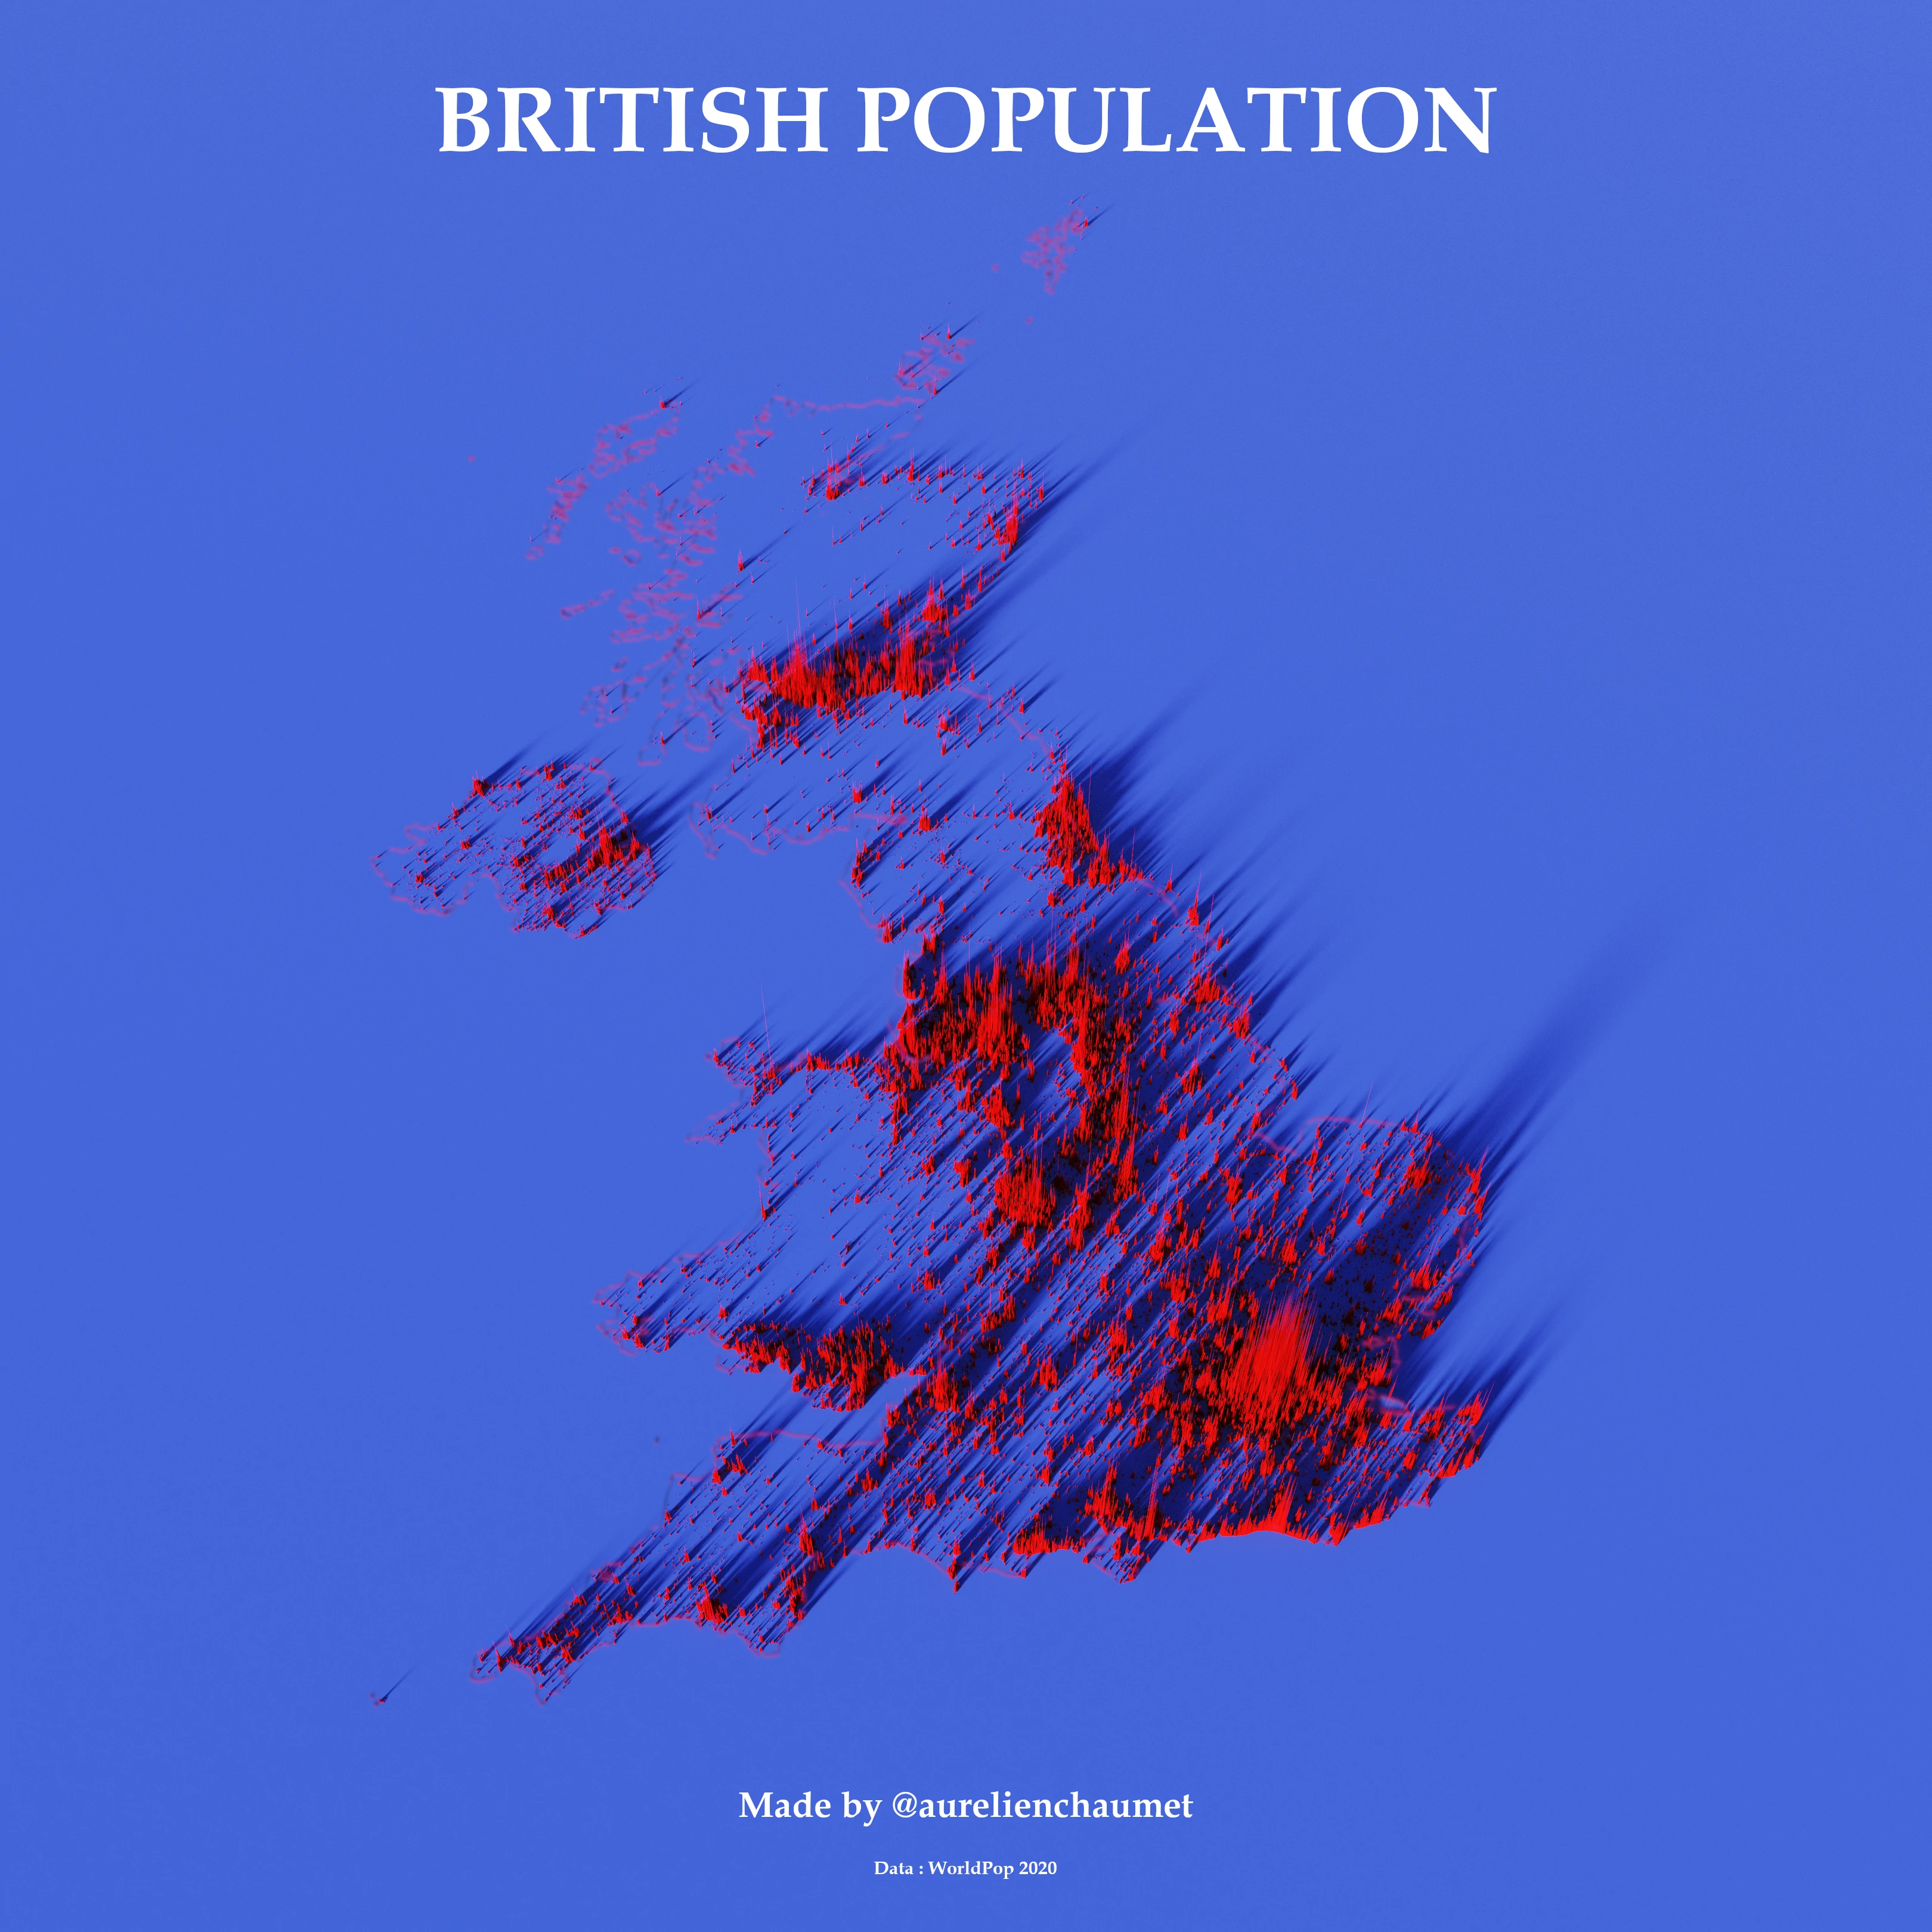
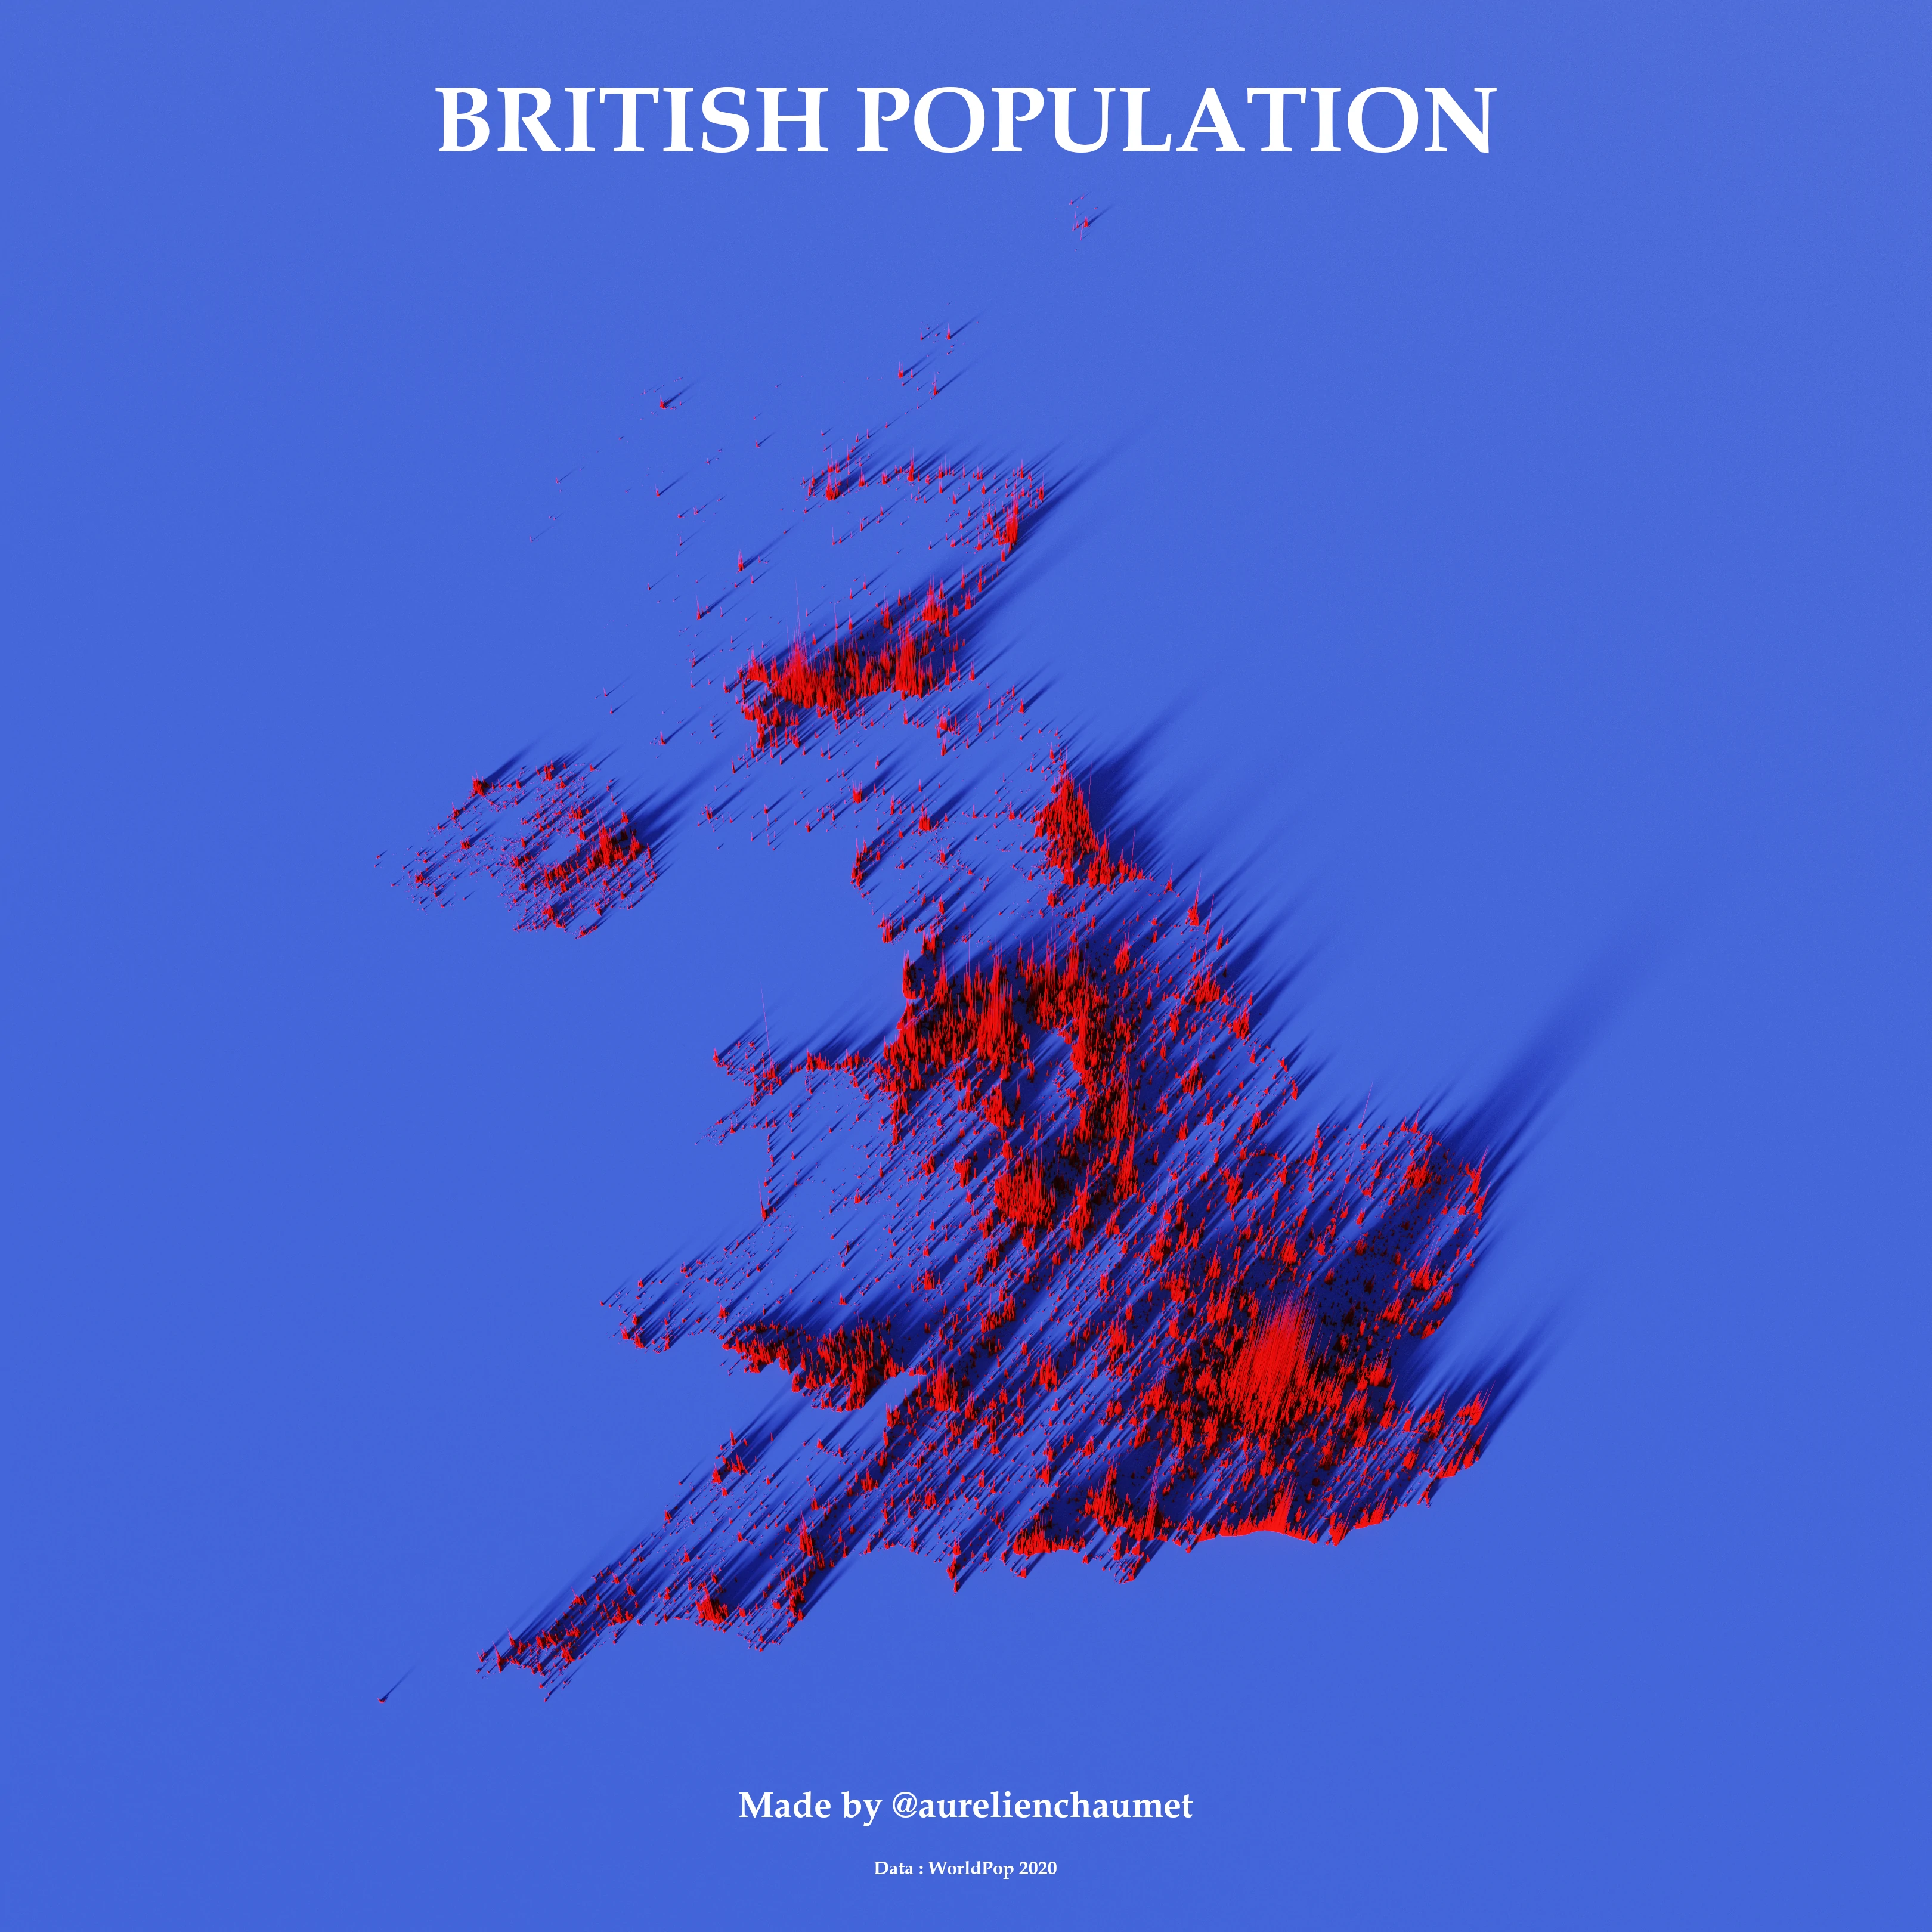
Europe


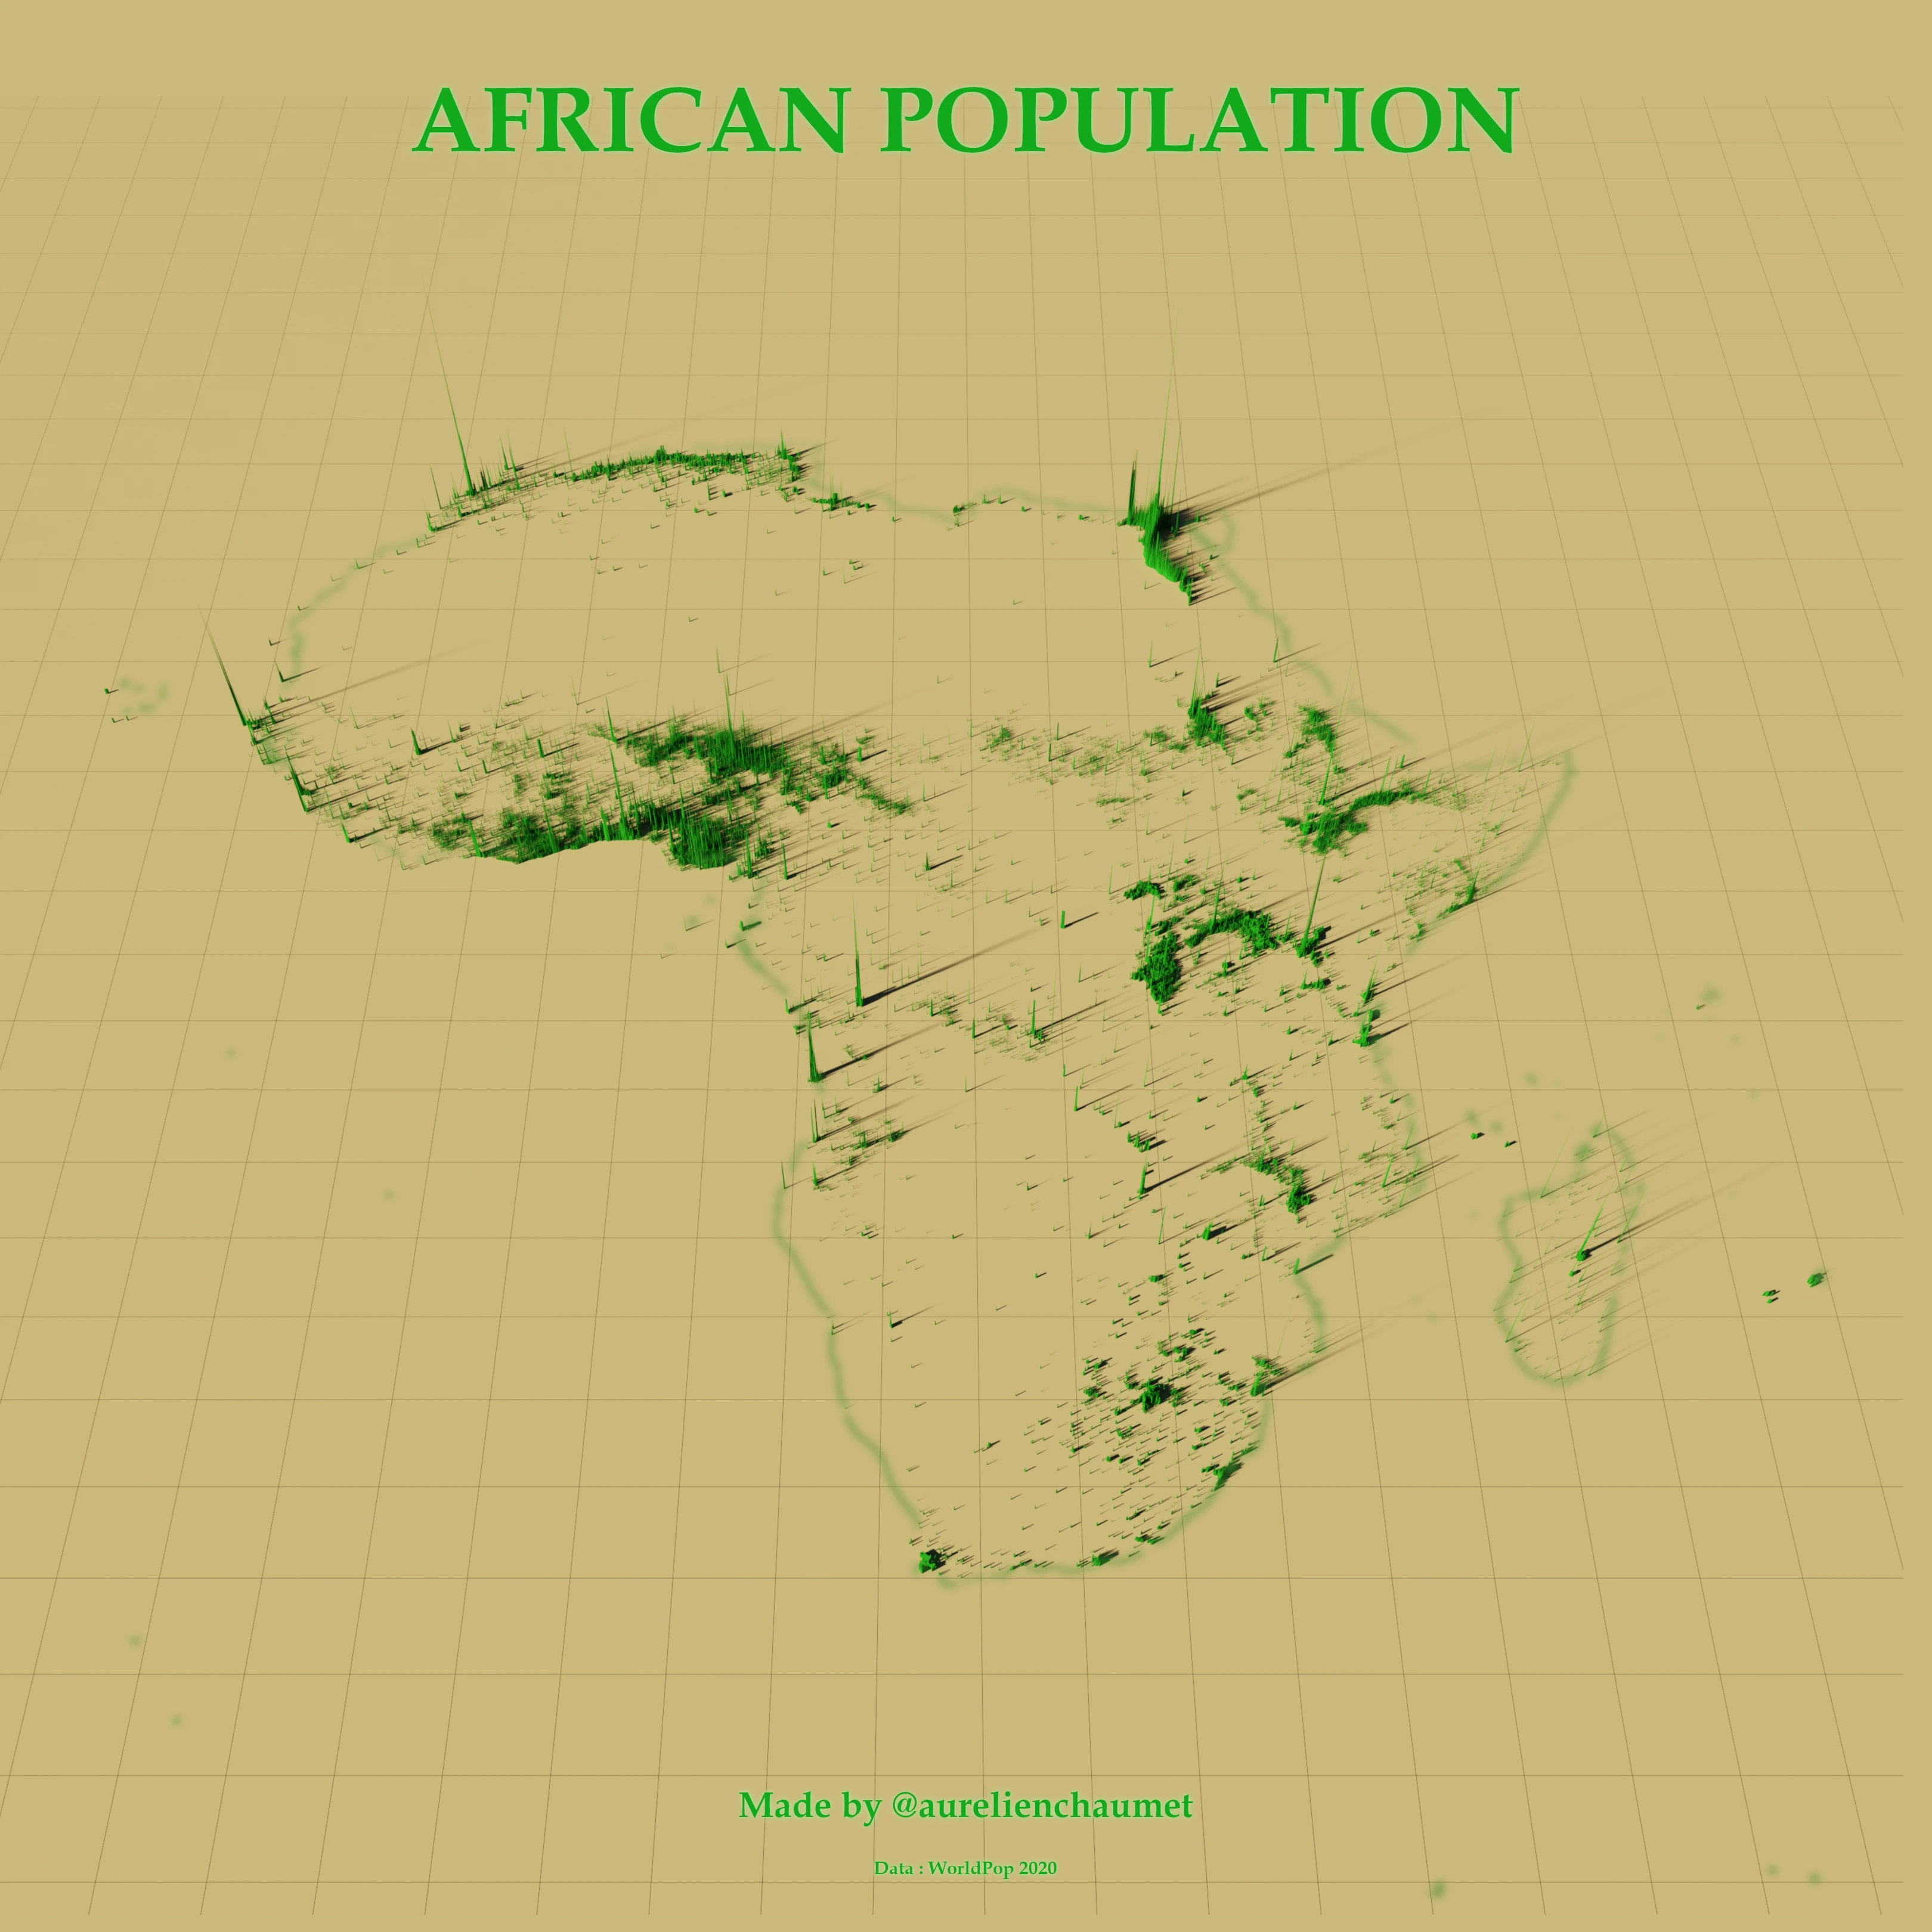
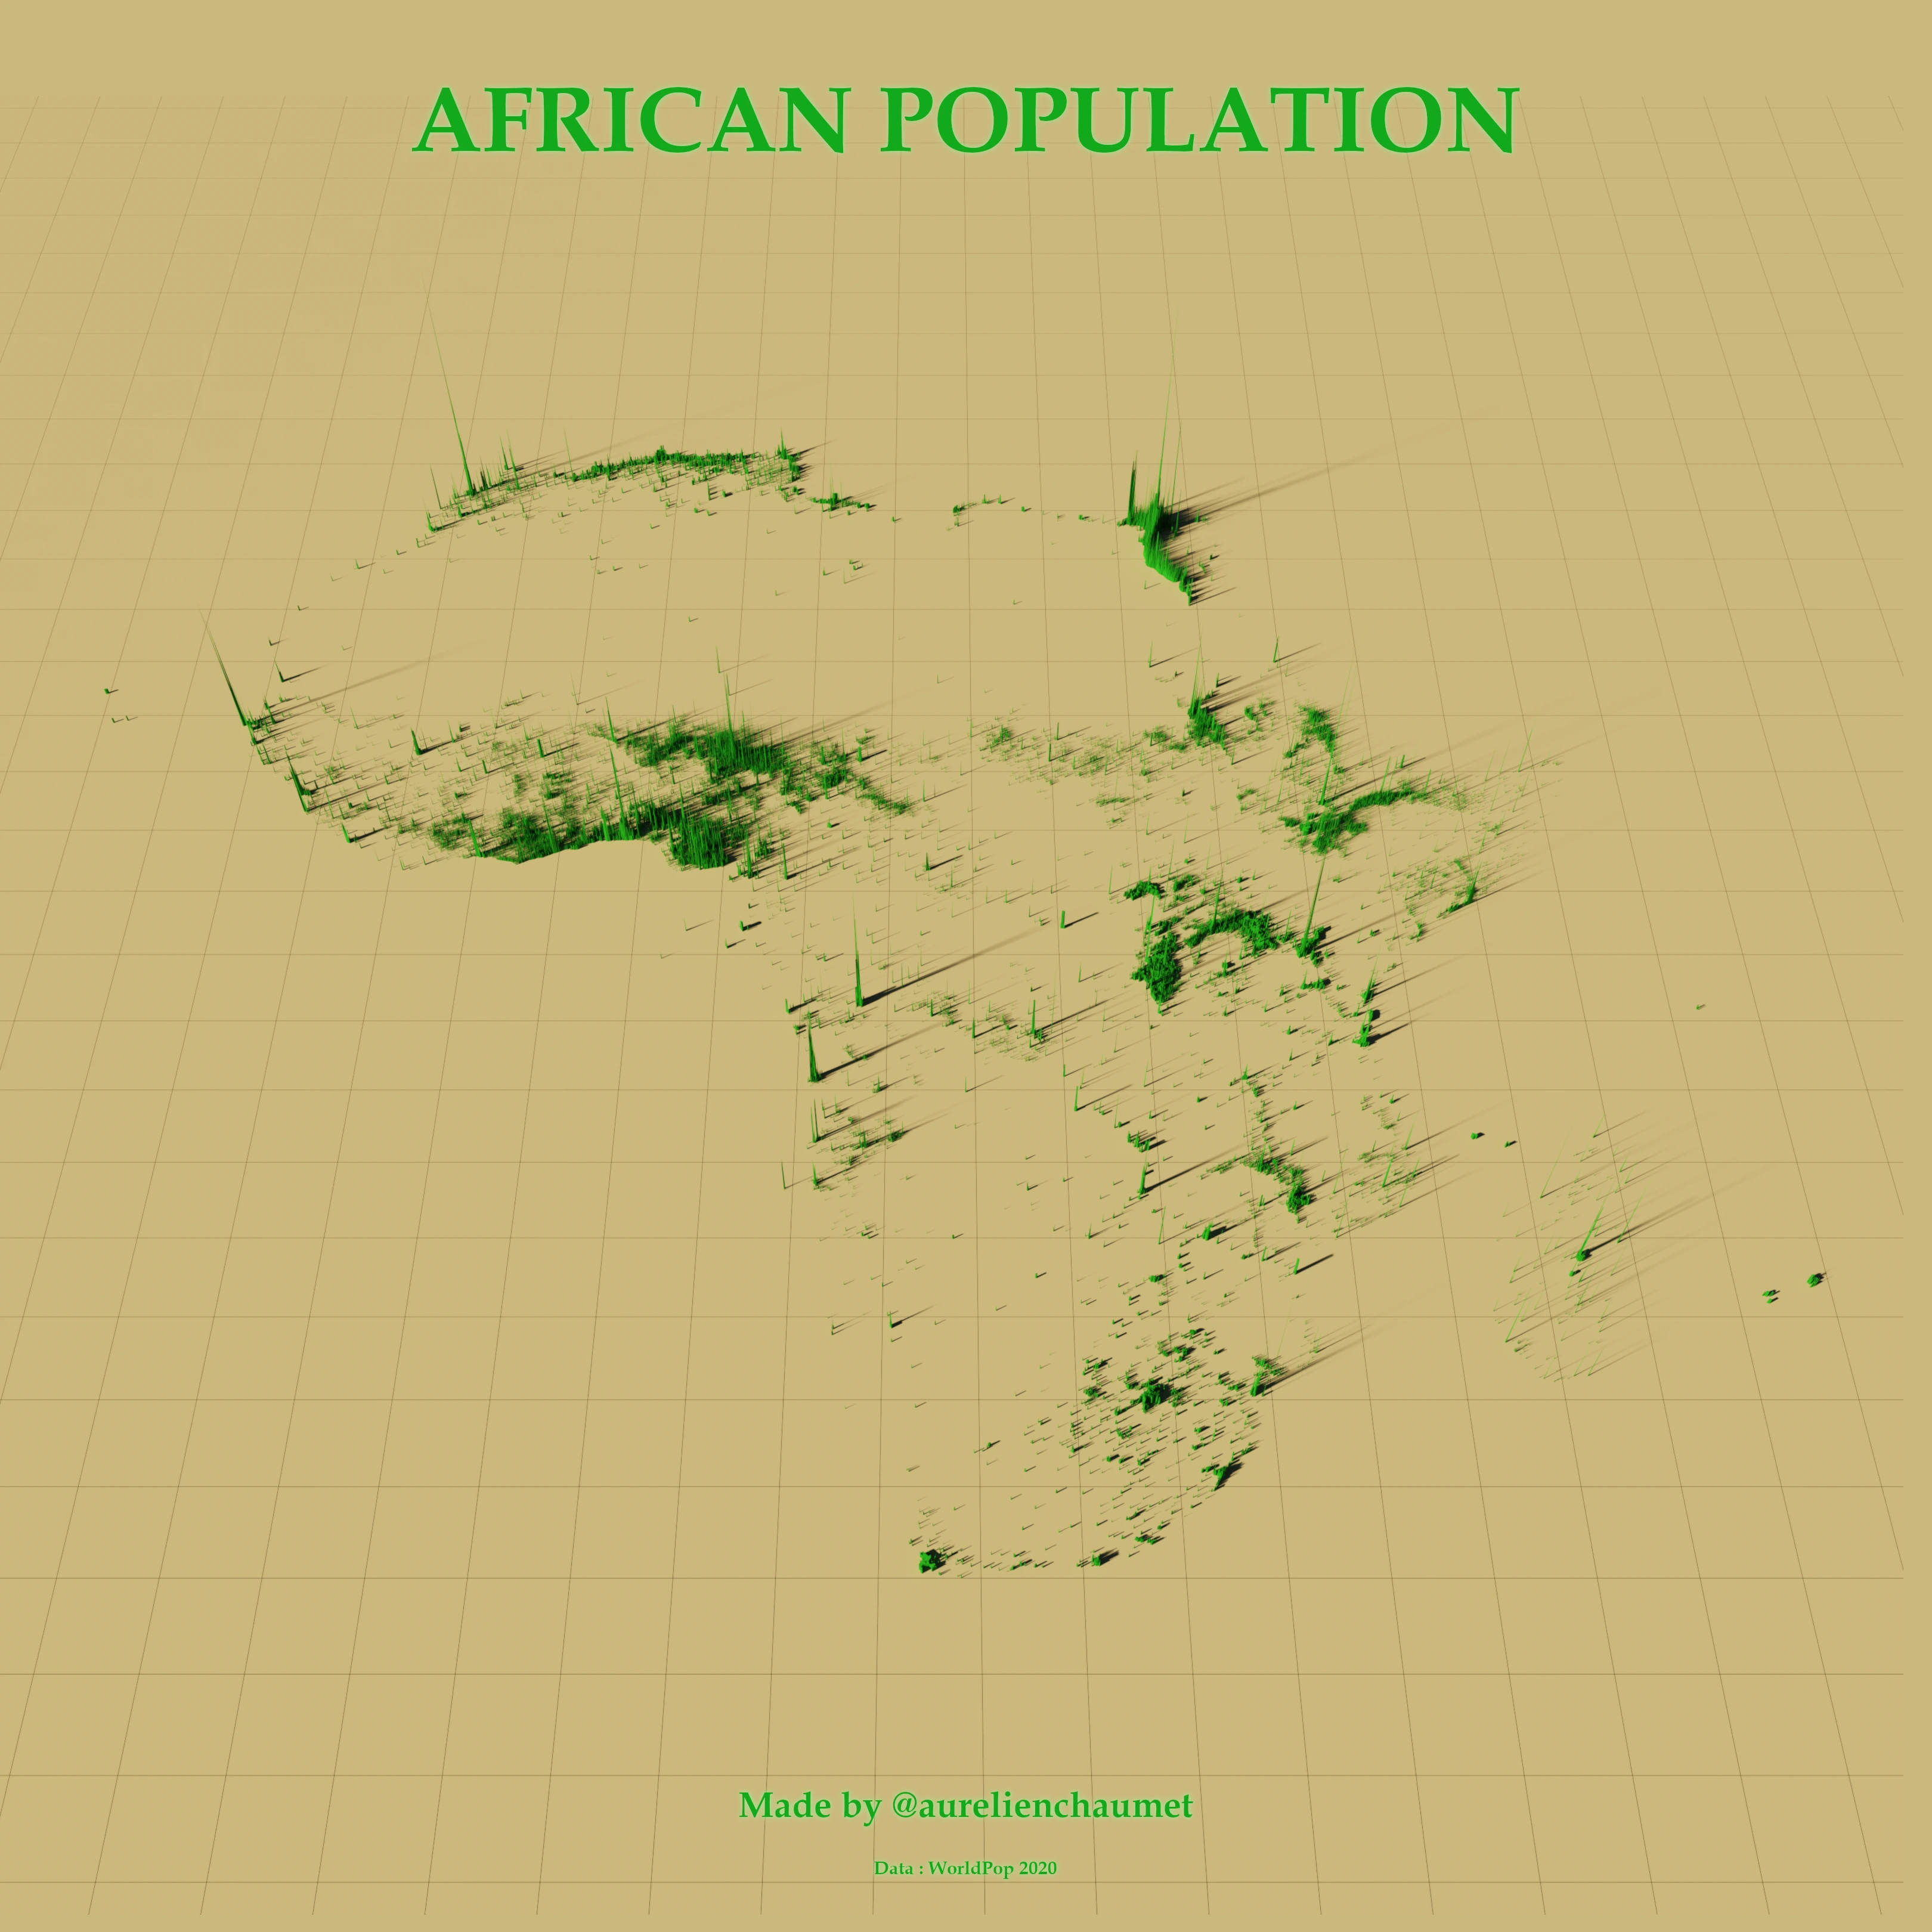
Africa
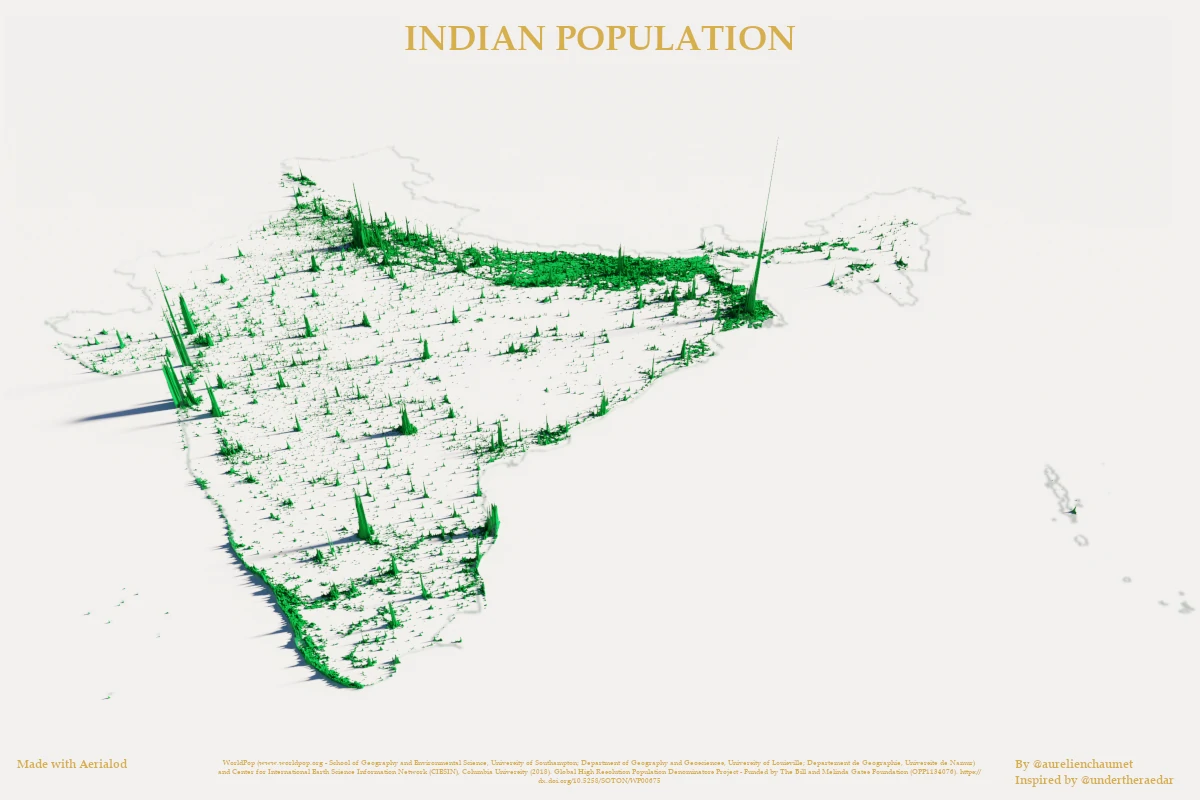
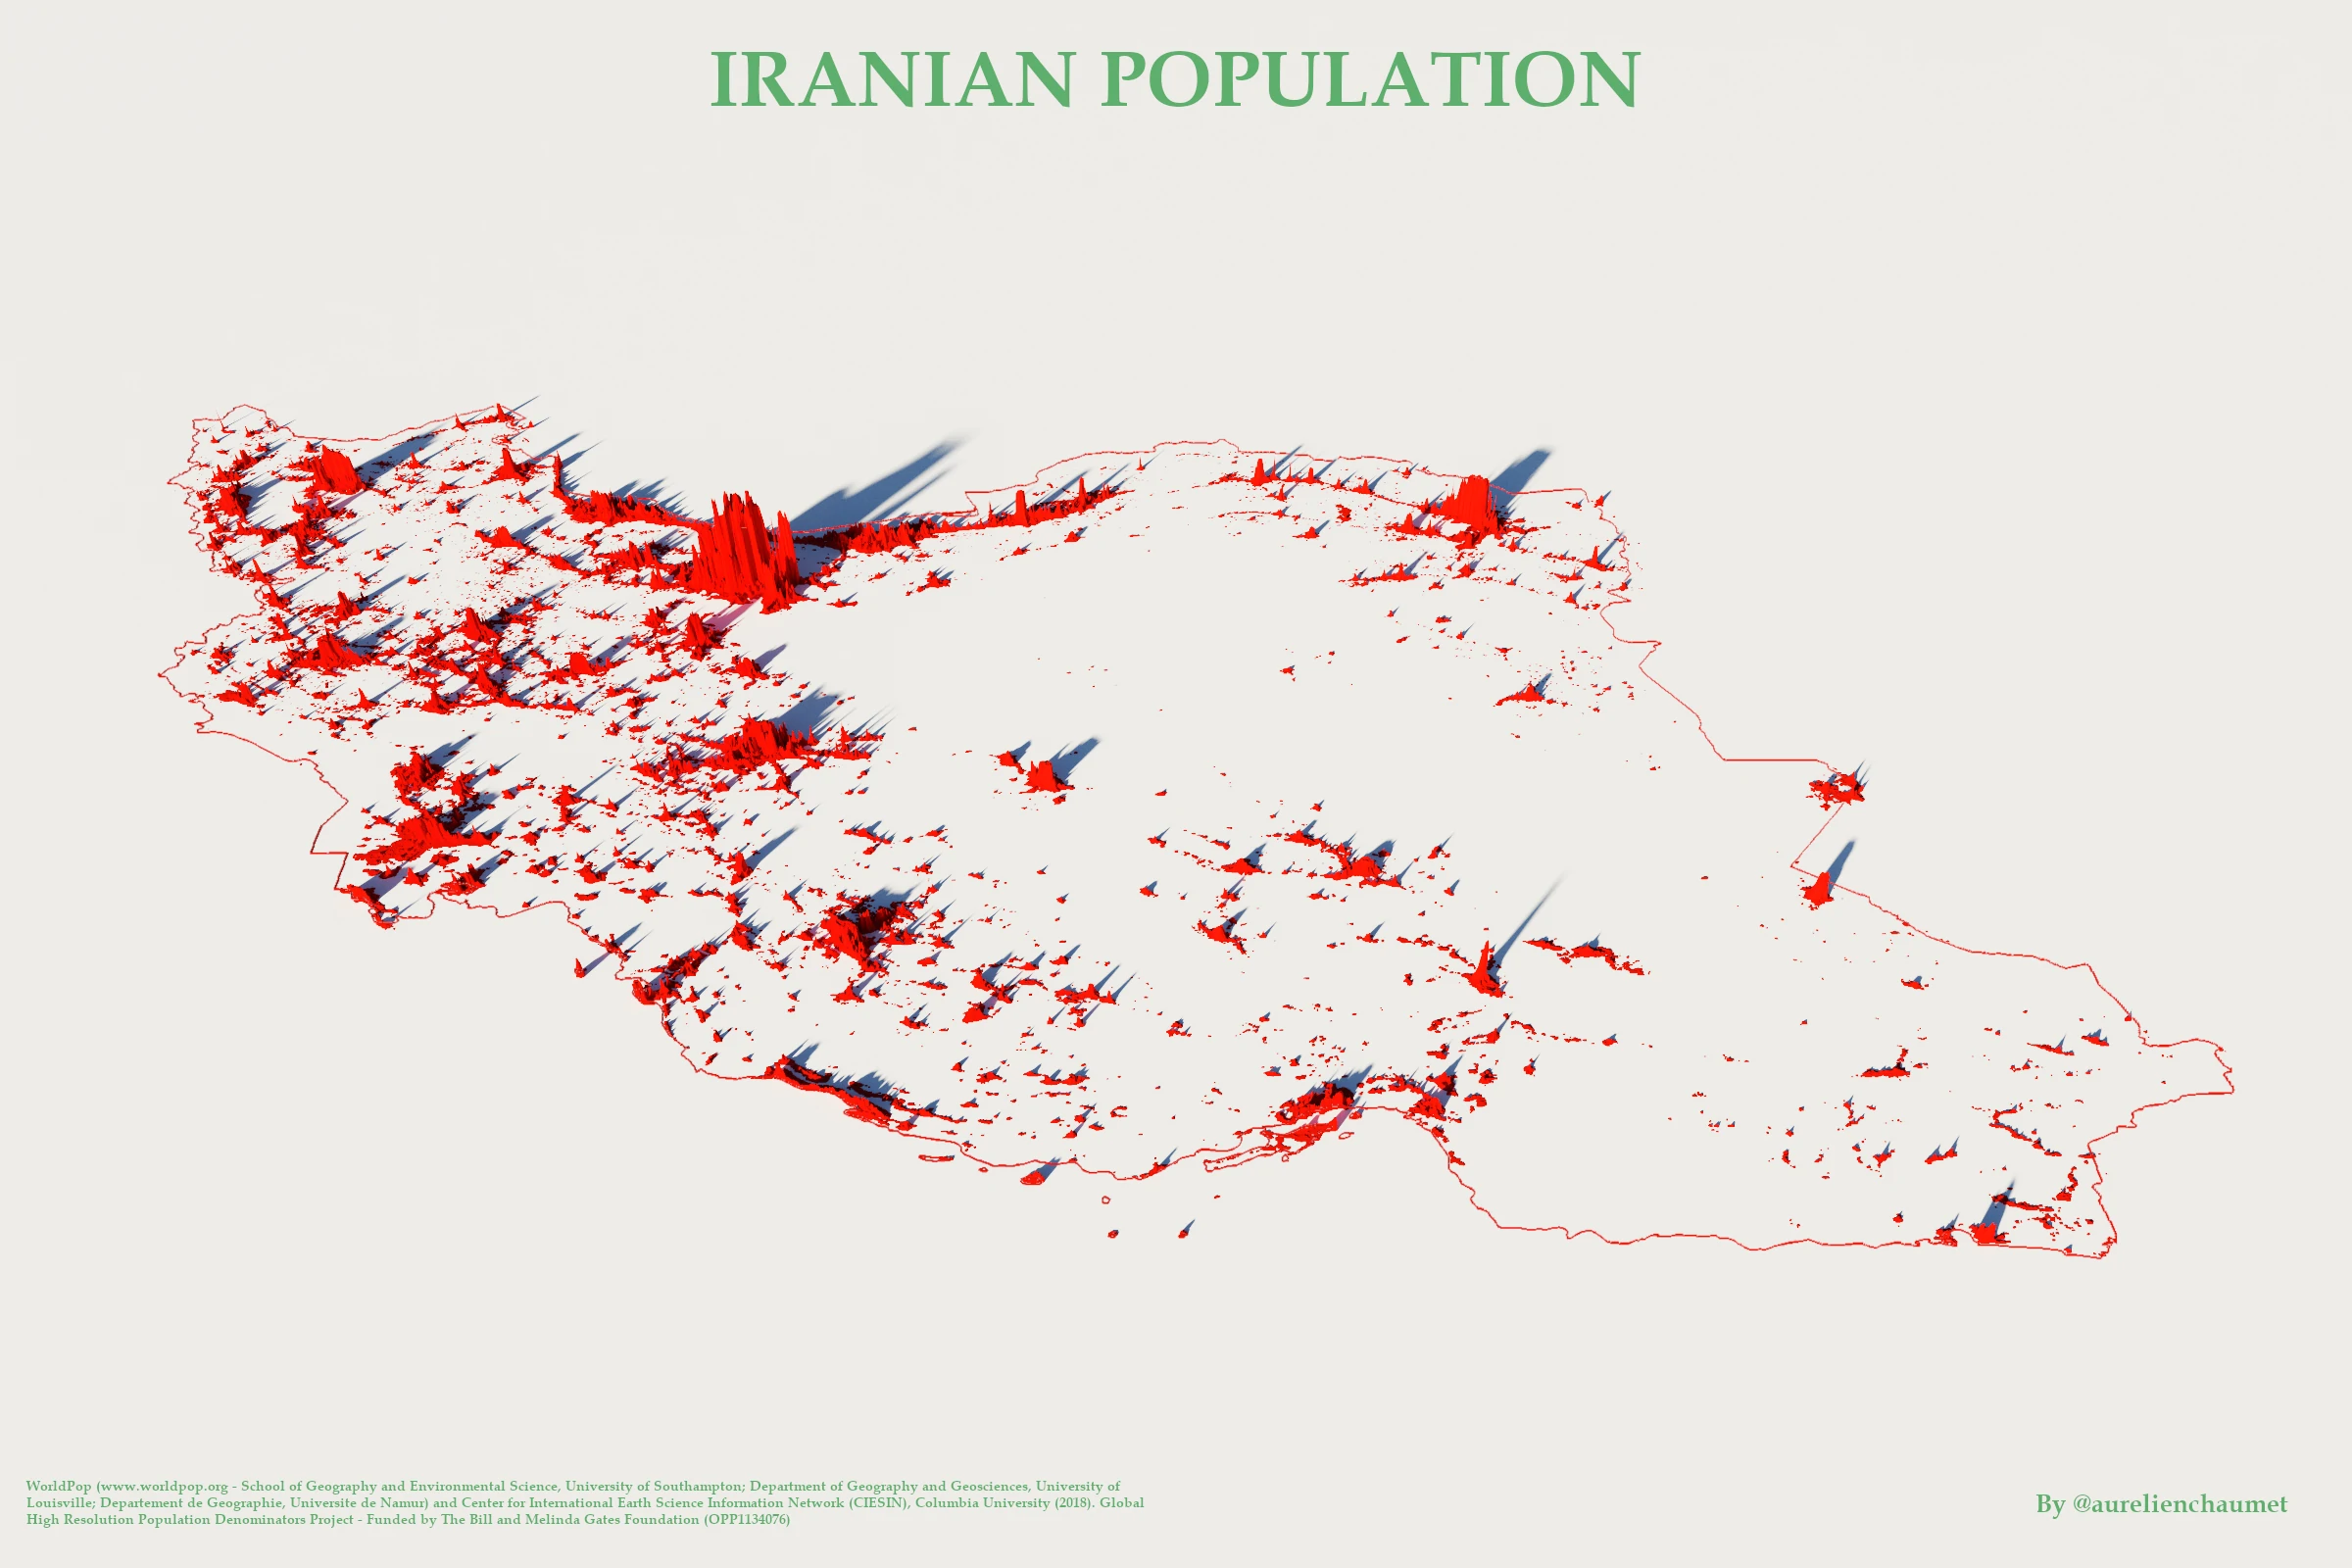
Asia


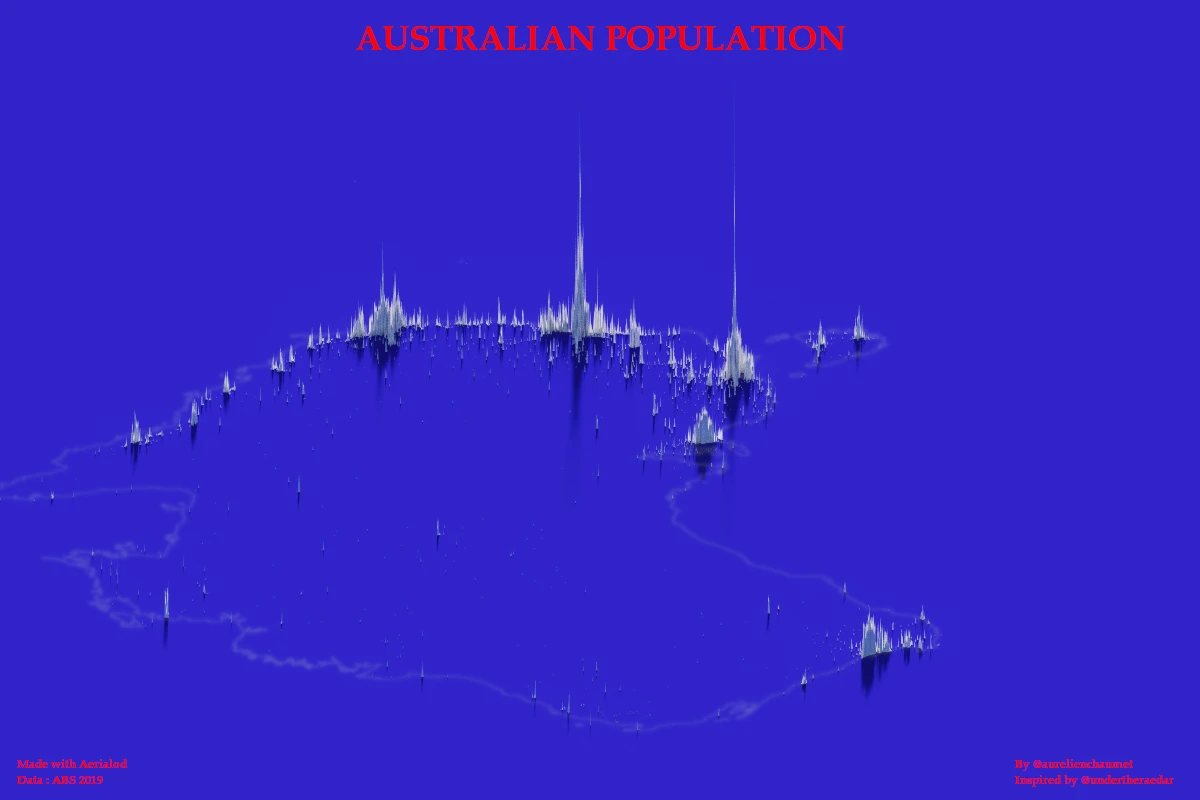
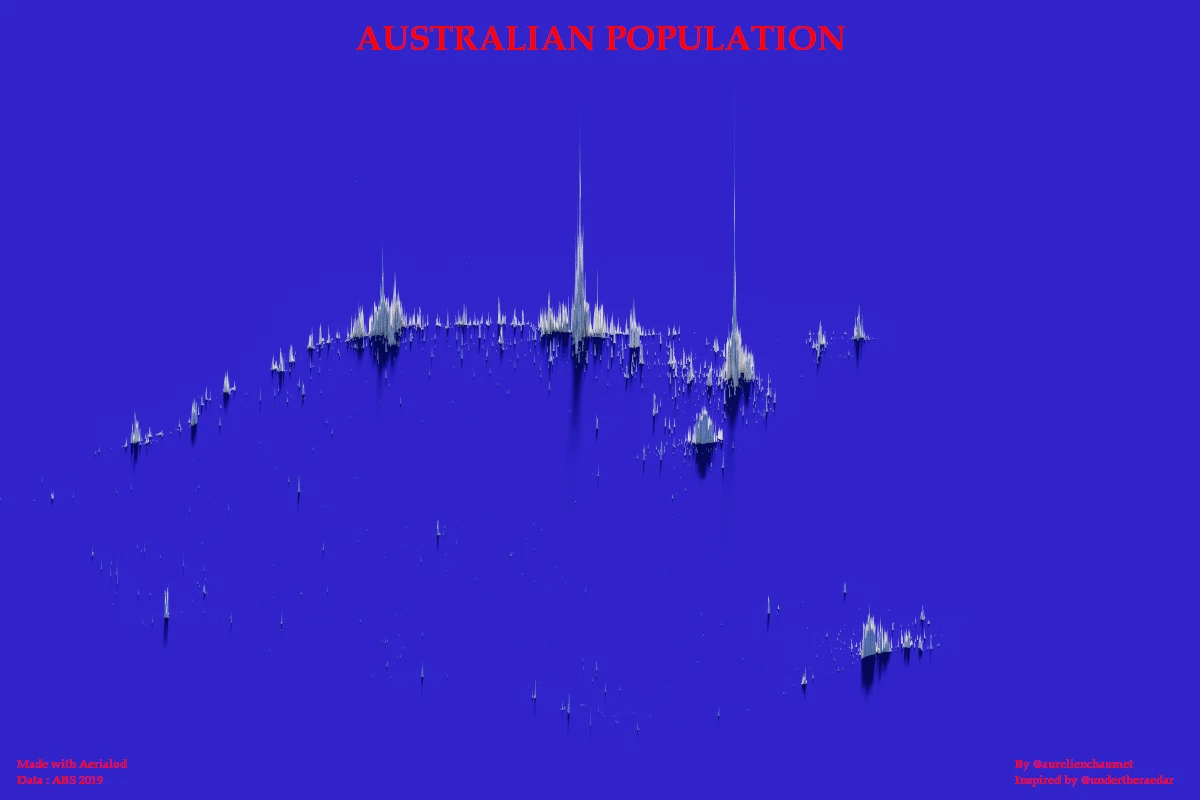
Oceania


Laisser un commentaire